


Deep Dive: Cu later?
Breaking down copper producers by asset and future demand

I hold quite a few miners and commodities stocks, across a number of different metals and minerals. Several of these metals and minerals are identified as “critical minerals” for the transition to electrification by the International Energy Agency (IEA) [1, 2]. Of particular interest are lithium and copper, for different reasons.
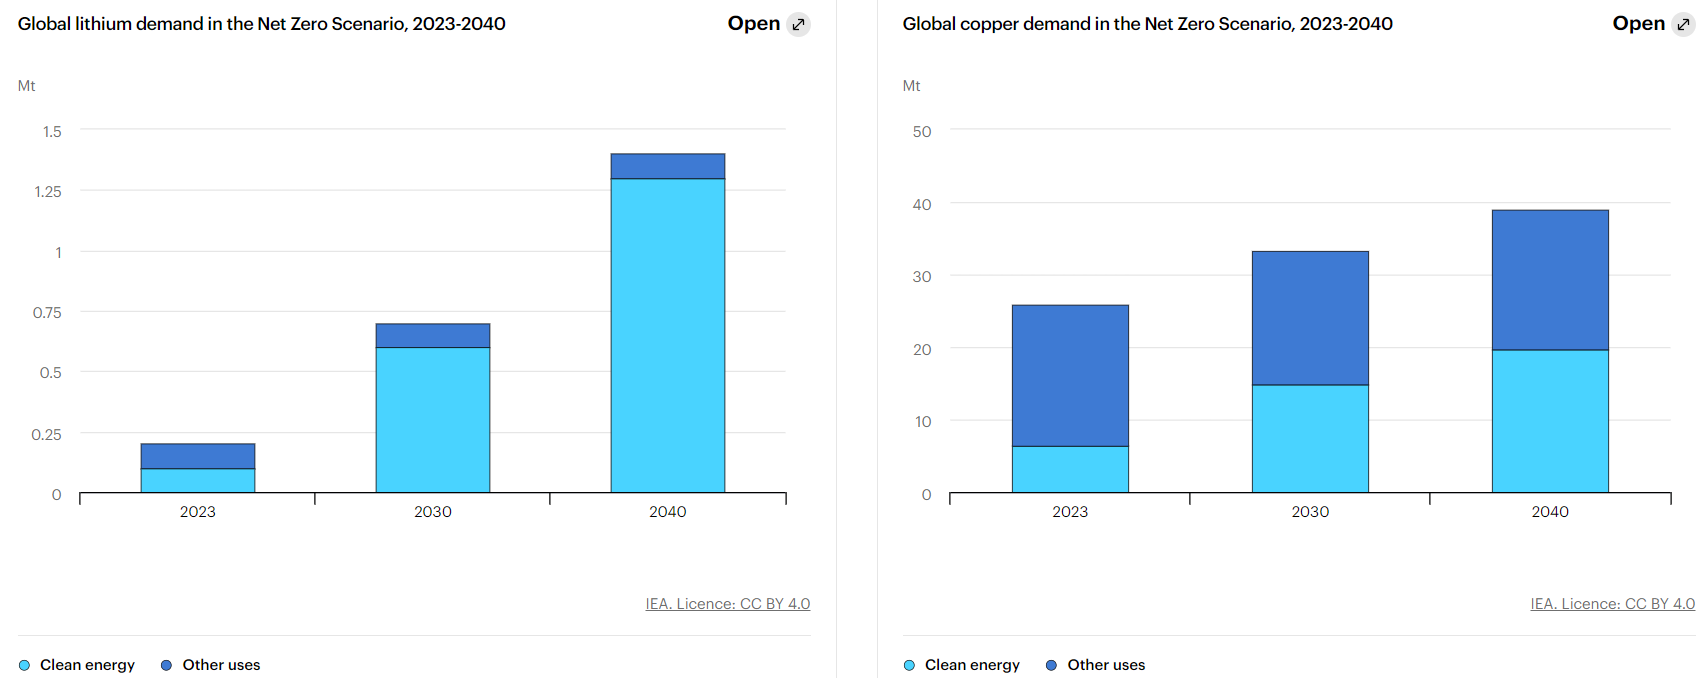
The IEA expects that lithium supply will be fairly well balanced against demand until the late 2020s under existing governmental policies (Figure 1), although this would not be sufficient to meet the IEA’s “sustainable development” scenario (aligned with Paris Agreement climate goals). On the other hand, copper supply is set to decline from the mid-2020s, with a significant shortfall predicted by 2030. A large part of the reason for this shortfall is that copper has one of the longest average lead times for bringing new assets onstream from discovery to production (17 years, according to [1]). However, copper demand from stated policies is close to the level expected to be required for sustainable development, meaning existing policies are likely to be almost all that are required.
The dominant market demand for lithium is for Clean Energy (shown in Figure 2), whereas copper is used not just for Clean Energy, but for ‘other uses’ as well, in approximately equal proportions. By comparing Figure 1 and Figure 2, it is apparent that the 2030 lithium demand for Net Zero policies (defined in [2]) is close to around half the quantity originally expected in [1], whereas the copper demand for Net Zero is over 30% higher than expected for the sustainable development scenario identified in 2021 [1].
The conclusion I reach from these IEA reports is that lithium demand is softening and is unlikely to face much of a shortfall in the near term, although there could be a large increase in demand if governments enact policies to push hard towards Paris Agreement goals. I also perceive that copper demand is increasing, with policies that are already supportive of Climate goals, at a time of reducing supply.

Copper demand for electricity infrastructure is much higher than the demand for electric vehicles and storage, but ‘other sectors’, not associated with Clean Energy, still make up the majority of copper demand. In this fashion, I believe copper can be considered to be somewhat more robust to the vagaries of political whimsy than some of the other energy transition metals (Figure 3).

Production by Miner
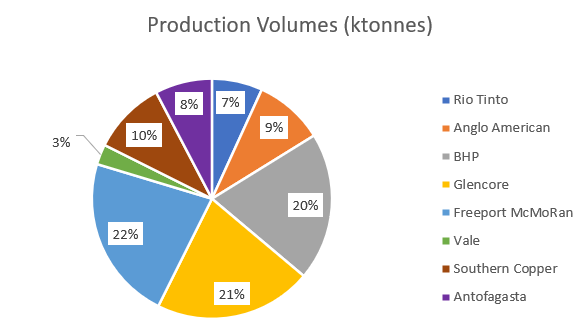
While global copper production in 2023 was around 22 Mtonnes [1], 8 producers accounted for over 40% of that quantity. These producers were:
Freeport McMoRan (NYSE:FCX)
BHP (LON:BHP)
Glencore (LON:GLEN)
Anglo American (LON:AAL)
Rio Tinto (LON:RIO)
Southern Copper (NYSE:SCCO)
Antofagasta (LON:ANTO)
Vale (NYSE:VALE)
I’ve included Vale, who are not a big player in the copper industry, as a comparator as they are a big player in another key commodity, iron ore (which is also of interest to me due to some of my commodities). However, I have not included Codelco, the Chilean state-owned copper producer, as they are not publicly traded. For reference, Codelco are of a similar size (in copper production terms) to BHP [3]. It’s worth highlighting that the values I have derived from reviewing the Annual Reports of each company do differ, in some cases substantially, from the values quoted in reference [3]. The reason for this is not immediately obvious, but it is possibly because I am only currently looking at production from major segment assets, not considering unsegmented sales or secondary supply, i.e. trades between companies or the processing (leaching) and sale of previously-mined material.
Production by Asset
So why pick one particular miner over another? Often, the quality of the assets owned or operated by each miner, as reflected in either production volume or ore quality, both of which may be expected to be reflected in the unit costs required to produce from each asset.
Looking at production by asset (as segmented in annual reports), colour coded by miner, shows that the single largest asset is Escondida in Chile, a mine owned primarily by BHP and Rio Tinto, with minor interest from a Japanese joint venture comprising ownership interests from Mitsubishi, Mitsubishi Materials and Nippon Mining & Metals. Freeport-McMoRan’s assets are not broken out mine by mine in their annual reports, but instead are segmented as Indonesia (which includes the Grasberg mine), North America (7 mines across New Mexico and Arizona, 100% owned by Freeport McMoRan except for the 72%-owned Morenci complex) and South America (which includes the Cerro Verde complex in Peru). The next largest asset is Anglo American’s Quellaveco complex in Peru. In short, the largest assets are shared across a number of the major producers - there is no single producer with a stranglehold on supply.

Costs of Production
Each asset has its own costs of production, influenced by the difficulty to extract and process ore, the ore quality, logistics costs, local labour costs, water supply and costs, etc. In many cases, the unit costs for each segment for each company are described in the respective annual report. However, not always. To attempt to provide a proxy for unit costs where it is missing, and perhaps to try and drive some better comparability, I have calculated costs another way.
Often, each company will provide revenue and EBITDA (or adjusted EBITDA) by segment, along with depletion, depreciation and amortisation costs and capital investments by segment. Capital Expenditure (CapEx) is typically broken into two sections - the ‘sustaining’ CapEx, required to maintain the already-developed assets and keep them operational, and the ‘development’ CapEx, enabling the company to expand operations or develop new resources.
To attempt to estimate the unit costs by asset, where the above information is supplied, I have taken the adjusted EBITDA and subtracted the larger of the depreciation or total CapEx expense, to produce an estimate of free cash flow before interest and tax. By using the larger of depreciation or CapEx expenses, I am attempting to capture the sustaining CapEx, but most likely also reflecting the cost of developing new assets. I have then subtracted this number from the segment revenue to estimate the amount of revenue not turned into my approximated free cash flow. I have then divided this effective operating cost by the production quantity to generate a proxy ‘effective’ unit cost in dollars per tonne (or dollars per pound ($/lb)).
Unit Cost = (Revenue - (Adj. EBITDA - max(DDA,CapEx) ) / Production Volume
This cost can then be compared against the current commodity price for copper, to estimate which assets are currently operating profitably (unit cost below current commodity price) or not. By excluding secondary supplies and including development CapEx costs, this proxy unit cost is often considerably higher than the quoted unit cost in the annual reports, meaning this profitability assessment is often a very conservative measure.
With this approach, as shown in Figure 6, the apparently most cost-effective assets are Escondida, as operated by Rio Tinto, and Anglo American’s Quellaveco (I am ignoring Antofagasta’s Zaldivar asset as it has no registered revenue). Freeport-McMoRan’s Indonesia / Grasberg facility is also relatively cost-effective, as is the Collahuasi asset (owned and operated by Glencore and Anglo American). At the other end of the scale, Rio Tinto’s Kennecott and Oyu Tolgoi appear very expensive to operative, but this is at least in part because there is significant development CapEx occurring at both complexes. Unfortunately, Southern Copper’s annual report didn’t provide enough of a financial breakdown by asset to enable me to analyse them in the same fashion as the other producers.
At the time of writing, the copper price of a little over $4/lb. Many of these assets could remain profitable with current levels of CapEx and production volumes as long as copper remains above ~ $3/lb. Figure 7 shows that prices have historically been $3/lb or less, so it is realistic that prices could return to those levels if new supply is brought online or if the predicted demand does not materialise. However, the trajectory expected by the IEA is for continued supply pressure, which may bode well for a lot of these copper producing assets.


If the cost per asset is weighted by 2023 production volumes by asset, an overall effective unit cost by producer can be devised. Through this perspective, Anglo American, BHP and Freeport-McMoRan appear to offer the lowest-cost-base copper production. Vale’s effective cost is low, but their relative copper production is also very low (Figure 4). Rio Tinto appear to have expensive assets, skewed by Rio’s capital investments on Oyu Tolgoi in Mongolia and Kennecott in North America. However, Rio’s cost base for their Escondida operation implies Rio can operate competitively against other miners. Similarly, Freeport-McMoRan’s North American operations have a cost base close to $4/lb, implying that Kennecott may be able to operate at a similar level if Rio choose to scale down their CapEx investments.

Conclusions
As a holder of Anglo American, Freeport-McMoran, Glencore and Rio shares, I remain happy with my copper exposure through these companies. Freeport-McMoran remain one of the biggest copper producers, while Anglo-American appear to be one of the most cost-effective producers. Rio have exposure to the single largest copper-producing asset in the world via Escondida. Although I have included Antofagasta in my above summary, I consider them to be a relatively smaller, relatively more geographically concentrated (therefore riskier) and relatively higher-cost producer, meaning they are not of much interest to me as an investment currently.
If I had to choose just one stock to hold, I would likely opt for Freeport-McMoRan, for their mix of high production volumes and a low cost base. If I were to reduce my copper exposure for any reason, I would likely reduce my Glencore holding. However, I don’t hold Glencore solely for its copper exposure (more for its nickel and cobalt - other transition metals).
Therefore, for now, I don’t intend to make any changes to my holdings, as I expect copper to continue to be a desirable commodity, but I believe I hold companies with the ability to remain profitable, even if the copper price drops.
References
International Energy Agency (2021), The Role of Critical Minerals in Clean Energy Transitions, Paris. https://www.iea.org/reports/the-role-of-critical-minerals-in-clean-energy-transitions/reliable-supply-of-minerals
International Energy Agency (2024), Global Critical Minerals Outlook 2024, IEA, Paris. https://www.iea.org/reports/global-critical-minerals-outlook-2024
Statista (2024). Leading copper mining companies worldwide in 2023, by production output. https://www.statista.com/statistics/281023/leading-copper-producers-worldwide-by-output/
https://tradingeconomics.com/commodity/copper