


Deep Dive: J Sainsbury (LON:SBRY)
Dissecting one of Britain's favourite supermarkets

This is a holding which I genuinely got lucky with. I was looking for a defensive stock in October 2022 (around the time Liz Truss was doing her best to cripple the UK economy) and I thought Sainsbury’s looked attractive at the time. I opened my position at 180p and added the majority of my holding at 191p. At the time, I hadn’t done a lot of research, so I kept my position small. I then did a bit of research and added a few more shares in March 2023 at 251p. Currently, my average price is 197p.
Since then, Sainsbury’s has traded as high as 310p and has only briefly dipped below 250p on a couple of occasions. However, it has recently dipped a little and is currently trading at around 261p, while rival Tesco has held its value better. I’m currently 33% in profit, and I have to ask myself if I still feel that SBRY is the best value defensive holding for me.
You can see my current valuation of Sainsbury’s here.
The UK Supermarket Scene
Groceries is an extremely challenging market with wafer-thin margins. The products are highly commoditised, meaning price is key and differentiation is difficult. Margins are typically very low, meaning the grocer is very sensitive to inflation, or anything which pushes its cost base up, as pushing too much cost on to the consumer can simply lead to consumers shopping elsewhere.
Statista sees Sainsbury’s as the second-most popular supermarket in the UK, in close competition for that spot with Asda, which was bought from Walmart by the Issa brothers in 2021, after a merger with Sainsbury’s was abandoned in 2018. Tesco is by far the most popular grocer in the UK. The last decade has seen fierce competition for market share from the ‘discount’ stores like Lidl and Aldi, and Sainsbury’s market share has declined around 2 percentage points from 2017 to 2023 (see Figure 1). As of October 2023, Statista states Sainsbury’s had a 14.8% share of the market, vs. Tesco’s 27.4% share.
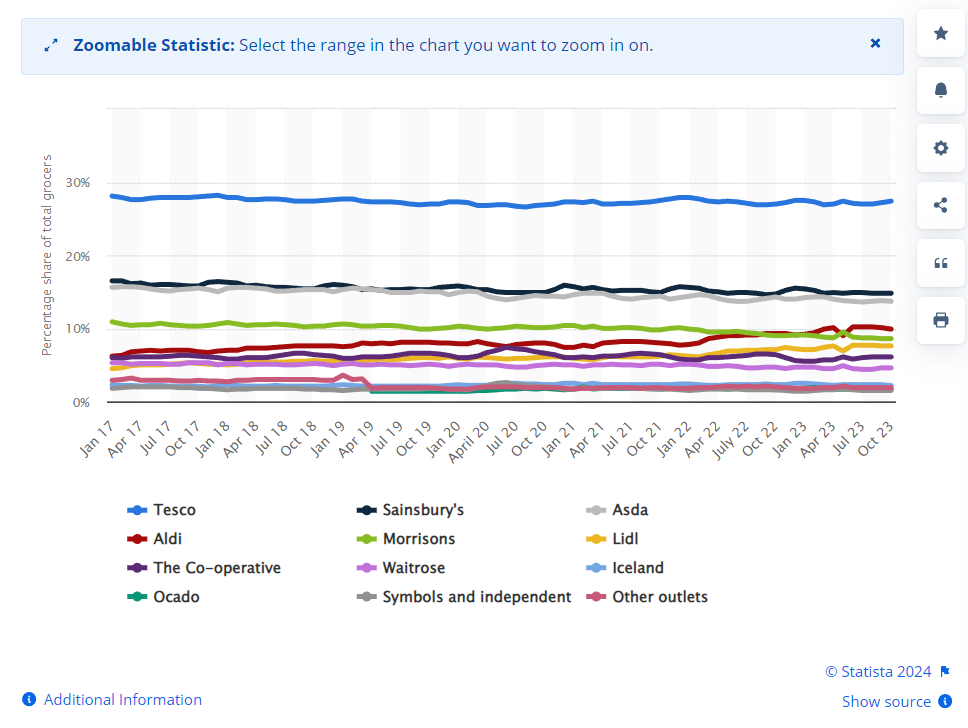
However, market research company Kantar’s more recent data paints a slightly rosier picture, with Sainsbury’s having 15.7% of the grocery market in the 12 weeks to January 2024 [1], shown in Figure 2, indicating a recent growth in market share. This is also the view of the Sainsbury’s management, with Simon Roberts [Chief Executive Officer] declaring in the 2023/24 preliminary results call that Sainsbury’s Grocery sales grew by 2.4 percentage points ahead of the market this year, and showing that, whereas Sainsbury’s was losing customers to Lidl and Aldi in 2019/20, it was gaining customers from all major supermarkets in 2023/24.

Brands and Strategy
According to their website, Sainsbury’s Group is made up of the following brands:
Sainsbury’s grocers
Argos
Nectar and Nectar360 (Nectar360 runs the Nectar programme and provides data analytics, an e-commerce platform and media services)
Habitat and Tu (on sale via Sainsbury’s and Argos stores)
Smart Charge (electric vehicle (EV) charge points available at a number of Sainsbury’s stores)
Sainsbury’s Bank
There are some important strategic elements to consider.
Sainsbury’s launched their ‘Food First’ strategy in 2020. Sainsbury’s had recognised that a number of their customers were buying occasional products from Sainsbury’s, but were doing the majority of their food shopping at competitors. Sainsbury’s sought to improve the value of their food offering to attract more customers to use Sainsbury’s as their primary grocer. Examples of this strategy in work are Sainsbury’s ALDI Price Match and Price Lock campaigns, Nectar Prices introduction, and the introduction of new food products.
Over the same timeframe, another of Sainsbury’s strategic drives was on ‘Brands that Deliver’, focusing on the Group’s other brands to support overall performance. An example of this was by using Nectar to generate data to help identify which products certain customer groups were buying, enabling more targeted investments in ‘Food First’ products. Another example has been the closure of a number of standalone Argos stores, moving them into Sainsbury’s stores, reducing rent / property costs and allowing easier access to services like ‘Click and Collect’. In January 2023, Sainsbury’s reported that Argos would leave the Republic of Ireland. In January 2024, Sainsbury’s announced it would exit banking and is looking at options for its Sainsbury’s Bank business
In February 2024, Sainsbury’s announced their “Next Level Sainsbury’s” strategy, detailing eight objectives, based around 4 pillars:
First choice for food (food volume growth ahead of market)
Loyalty everyone loves (leveraging Nectar360 capabilities)
More Argos, more often
Save and invest to win (saving £1B of costs, > £500M free cash flow from retail each year through 2027, higher return on capital employed)
To deliver on these objectives, Sainsbury’s expects to increase capital expenditure to between £800M - £850M per year (the 2023 Annual Report shows Core retail capital expenditure, excluding strategic expenditure, has risen around 9% per year on average since 2018/19, to £717M in 2022/23. For reference, total capital expenditure before disposals was around £740M in 2022/23). This implies - very crudely - an annual increase in CapEx over the next 3 years of between 8% and, at most, 18%, although I believe an increase of closer to 10% is more likely. Included in these numbers is a specific investment of £70M being made in the coming financial year in their Smart Charge EV charging network.
£500M+ retail free cash flow per year is the same target at Sainsbury’s have had since at least 2021. They achieved £645M in 2022/23, which is also close to the £636M average retail free cash flow achieved since 2019/20.
Segment Information and Profitability
Sainsbury’s reports 2 segments, their Retail segment, which includes food, clothing, general merchandise and fuel products, and their Financial Services segment, which includes banking and insurance products sold through Sainsbury’s Bank and Argos Financial Services.
However, Sainsbury’s also disaggregate the revenues from their Retail segment, providing insight into the breakdown between Grocery, General Merchandise and Clothing (GM&C) and fuel. Broadly, GM&C accounts for around 85% of revenues, fuel is around 14% of revenues, and Financial Services account for 1% - 2% of revenues. In the recent 2023/24 results presentation (25th April), Simon Roberts stated that food was “three quarters of [the] business”, indicating that general merchandise makes up the remaining 10 percentage points or so of the GM&C segment.
Looking at the trends over time clearly identifies what I hope to see from a defensive stock like Sainsbury’s. GM&C revenues have grown almost 3% per year on average since 2018/19 Financial Year (FY) through to the 2023/24 FY, released as preliminary results this week. Their 2021/22 results showed only a 2.5% drop from 2020/21, which had shown an increase of over 7% from 2019/20, as people spent more time at home and consumed more over COVID. And, even with the very high inflation seen over the last year or so, GM&C revenues had increased only 4% in the twelve months to September 2023, and have increased a little under 7% over the twelve months to March 2024. This shows clear cost control, not passing on the full inflationary cost to consumers. Grocery revenues were actually up over 9% in the last twelve months, but were offset by weakness in General Merchandise, blamed on the closure of Argos in the Republic of Ireland. Although poor summer weather in 2023 was also highlighted as a cause for subdued revenues in the preliminary FY results call, particularly affecting Home and Furniture and Seasonal and Garden products, Simon Roberts stated that General Merchandise grew 1.2% over the last FY excluding the effect of Argos’ withdrawal from Ireland.
Contrast the relative stability of Grocery revenues with Fuel revenues, which dropped 16% in 2019/20 vs. 2018/19, and then dropped a further 39% for the full year 2020/21, before rising 60% in 2021/22 and then 24% in 2022/23. In the twelve months to September 2023, with inflation dropping, fuel revenues had fallen back 11%, and have now fallen back 14% in the twelve months to March 2024. The effect of Covid and the subsequent high fuel costs from the period of time when Russia invaded Ukraine is very obvious. However, because GM&C dominates the Retail segment, overall the year-on-year growth for the whole segment has been between 2% and 3% over the last 5 years, with a peak of 5% between March 2021 and March 2022. These are not high numbers and they are fairly stable, considering the economic turmoil of the last few years.
Financial Services as a segment has been as similarly volatile as fuel, with between -24% and +23% changes year-on-year, but with an average year-on-year revenue growth of 7% (6% CAGR) since 2016/2017.

However, because Fuel and Financial Services are small contributors to the overall revenue, revenue growth is dominated by groceries. From the preliminary 2023/24 results released this week, as mentioned above and shown in the corresponding results presentation [2], Grocery has grown 9% over the last year, although more of the growth came over the first 6 months of the FY, with growth slowing a bit over the most recent 6 months (relative to the same period in the prior year).
In terms of where the profit comes from, typically 95% of Sainsbury’s underlying operating profits comes from the Retail segment (GM&C and fuel), which has had a segment profit margin of around 3% on average over the last 5 years (but closer to 2% over the last twelve months). That said, operating profit in the Retail segment has been growing over the last year vs. the prior year, particularly over the last six months (source: 2023/24 FY preliminary results [2], slide 13).
These narrow margins mean Sainsbury’s incessant focus of cost savings is a major contributing factor to their profits. They have achieved £1.3B of savings since launching their Food First strategy, including £350M of savings over 2023/24 FY. This is in spite of what I calculate to be a 7% increase in Selling, General and Administrative (SG&A) costs of 7% in 2023/24 FY vs. 2022/23 FY, and something like a cumulative increase of 17% - 18% in SG&A costs since 2019/20 FY (Sainsbury’s themselves estimate this increase to be nearer 17%, whereas I try to isolate exceptional items from their accounts, meaning I end up nearer 18%). This has, in part, been managed by tight control of employee costs over the last few years, including a reduction in headcount of 8% - 9% over the course of the 2022/23 FY (I don’t yet have the numbers for the 2023/24 FY). SG&A typically runs at around 5% of revenues. Sainsbury’s is targeting a further £1B of cost savings over the next 3 years under their “Next Level Sainsbury’s” strategy.
The Financial Segment is profitable, and generally has higher margins than the Retail segment, running at around 5% margin on average over the last 5 years. However, margins took a big hit over 2023/24, declining by 4 percentage points (from a margin of around 8.7%) over the last twelve months. I estimate this to be an approximately 47% relative drop in operating margin, but Sainsbury’s are declaring the same numbers as a 37% drop in absolute underlying profits before tax. To each their own! Whichever way you cut it, the Financial Services segment is a small part of Sainsbury’s profits, and is under pressure. In the results call, Bláthnaid Bergin [Chief Financial Officer] stated the reduction in profits was due to higher interest rate costs being experienced by the Sainsbury’s Bank core banking products (loans, deposits, credit cards), where the full cost to Sainsbury’s is not being passed on to customers in order for Sainsbury’s Bank to remain competitive [3].
As mentioned previously, Sainsbury’s have recently declared they intend to exit the banking segment, and the winding down of their banking activity is very clear from their 2023/24 FY financial statements, with a reduction of Financial Services assets of £875M and a reduction in Financial Services liabilities of £225M, including a release of £234M of working capital from Financial Services changes.
So, to summarise:
Sainsburys revenues and profits are dominated by Grocery, but Fuel makes a meaningful contribution
Margins are very thin, and relentless focus on cost control is paramount
The banking business is under pressure from the higher interest rate environment, but Sainsbury’s are taking steps to manage their exposure to this segment
Group Profitability
At this point, a slight word of caution is required - the majority of the preceding discussion has been underlying profitability, i.e. excluding exceptional items, interest and tax expenses.
So how does Sainsbury’s stack up on a statutory basis? Earnings Before Interest and Taxes (EBIT) margin (i.e. EBIT as a proportion of revenue) is around 1.6% and has been pretty flat over last 2 years, declining from 1.8% in 2022/23. This compares to an average 2% EBIT margin over the last 5 years. 2021/22 was an unusually good year, at 3.9% EBIT margin, while 2020/21 was an unusually bad year, at 0.5% EBIT margin.
Net profit margins are roughly 0.5% on average over the last 5 years, and have declined from 0.6% in 2022/23 to 0.4% in 2023/24. Including employee costs, which are generally 11% to 12% of revenues by themselves, gross margins have declined from 13.4% to 11.5% over the last 5 years, a reduction of roughly 3% per year. Excluding employee costs, gross profits have been pretty flat at 24% or so over the 4 - 5 years to 2022/23 (I don’t yet have employee costs for 2023/24).
Sainsbury’s typically spends something like £300M a year on restructuring expenses, and has had an average of £580M of Exceptional Expenses (including fair value adjustments, impairments, sale of assets, as well as restructuring expenses) per year for the last 5 years. This is of a similar magnitude to the average operating income over the last 5 years of £610M per year. In other words, without the exceptional items, operating income would be close to twice as large as declared on a statutory basis. This is also confirmed by the results in 2021/22, which had unusually low adjustments for exceptional items, and delivered operating income of £1.1B.
Sainsbury’s has a lot of leased properties, which leads to leases making up a large part of Sainsbury’s total debt, and lease costs making up a significant portion of Sainsbury’s overall interest payments. As of March 2024, i.e. as of the end of the 2023/24 FY, leases made up 89% of current debt and 82% of total debt. Sainsbury’s interest cover (EBIT relative to interest payments, including lease payments) is around 1.6. This shows that Sainsbury’s interest payments are affordable (interest payments are generally less than EBIT), but I personally wouldn’t want to see any lower interest cover, and I would feel more comfortable if interest cover was above 2, i.e. interest payments were less than half of EBIT. The interest cover excluding leases is much better, but this is of little concern to me, given the significant contribution of lease liabilities to Sainsbury’s overall debt obligations.
The cost of debt (including leases), on average, is around 3.8%, down from the 4% - 5% seen in 2018 - 2020. This is despite the 2022 Sainsbury’s Bank Tier 2 notes paying interest at 10.5%! Thankfully, these notes are only around 10% of the total issued debt, and around 2% of total debt including lease liabilities. Looking at debt maturities, there are no cliff edges coming in the next 5 years, so I don’t perceive any refinancing risk on the near horizon.
Statutory earnings in 2023/24 dropped by around one third, compared to 2022/23. Although revenues increased by almost 4% over the last FY, the increase in SG&A expenses, partly offset by a reduction in exceptional expenses, led to a roughly 5% drop in EBIT. Higher tax and interest expenses, in conjunction with the lower EBIT, have then caused the lower earnings. However, despite this substantial reduction in statutory earnings, cash flow from operations dropped by less than 7%,.
Working Capital and Cash Flow Management
The significant difference between statutory and underlying results discussed in the preceding sections implies that Sainsbury’s cash flow management is quite different to their statutory reported results.
Sainsbury’s has been bringing in roughly £2B in Cash Flow From Operations (CFFO) for the last couple of years. Generally, CFFO has been increasing since 2016/17 (which is the first year of reports I have analysed), although 2022 was a year with relatively low CFFO. Capital Expenditure (CapEx), by my calculations, has typically been running at around £500M - £750M since that time, but last year saw a marked increase to over £1B. Part of this has been a targeted investment of £63M in electric vehicle (EV) charging infrastructure, and next year (2024/25) will also see a further £70M investment for EV charging, as mentioned previously, and part of this has been due to changes in Sainsbury’s property portfolio. My CapEx calculations use the Statement of Cash Flows and include tangible and intangible capital asset expenditure, less disposals, whereas in their preliminary results presentation, Sainsbury’s have broken out Retail CapEx (including EV charging investments) of £814M, from £670M paid to Highbury & Dragon for their portfolio of stores. This purchase of real estate from Highbury & Dragon has also released Sainsbury’s from over £1B of lease liabilities, enabling a reduction in net debt of £372M due to this transaction. In total, Sainsbury’s have been able to reduce their total debt liabilities, including leases, by almost £600M in 2023/24. The reduction in lease liabilities should show up in future years as a reduction in interest payments, hopefully improving the interest cover I flagged as a concern.
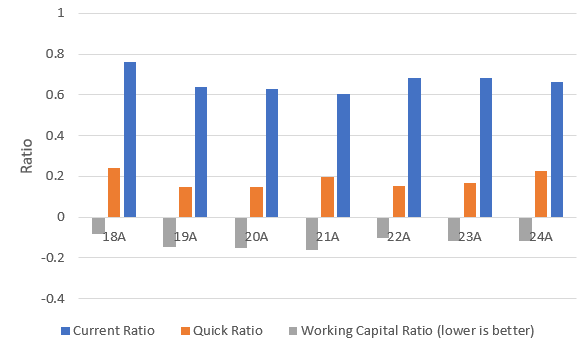
Working Capital (the difference between Current Assets and Current Liabilities) is ‘lumpy’, with year-to-year movements of over £870M, sometimes showing a reduction in working capital and sometimes an increase. One metric for Working Capital is the Current Ratio, calculated as the ratio of Current Assets to Current Liabilities. Conventional wisdom states that a company should have higher Current Assets than Current Liabilities, or there is a risk that the company cannot pay its bills over the coming year. However, grocers are a bit of a special case. They engage in long-term contracts with their suppliers, tying them in to contractual liabilities. They sell the majority of their product to the public, who are under no contractual obligation to buy the goods. Instead, the grocer relies on rapid turnover of inventory to turn payables into inventory and then into cash. This can often lead to a negative level of working capital and a Current Ratio below 1.
This is what we see with Sainsbury’s, where Current Assets are consistently between 60% and 70% of Current Liabilities and Working Capital is typically (11%) of revenues. The important points in Figure 4 are that Current Ratio and Working Capital Ratios are fairly constant - there is no obvious trend of these ratios getting worse over time. Quick Ratio (which is the ratio of cash, marketable securities and accounts receivable to current liabilities) is low, at 0.2, meaning Sainsbury’s can only pay around 20% of its current liabilities without converting inventory and other current assets to cash, but Quick Ratio is also at the highest level it has been for several years.
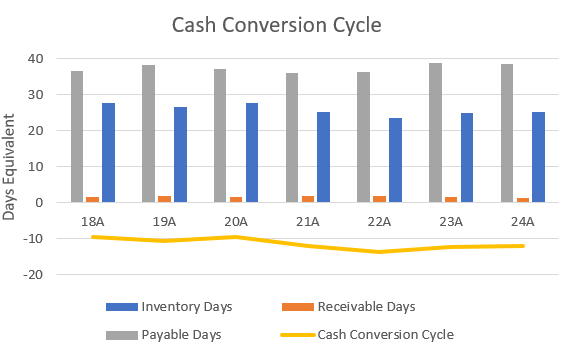
This becomes more clear if we look at the breakdown of inventory, payables and receivables. As shown in Figure 5, the number of days’ equivalent of inventory has steadily decreased from around 27 days in 2017/18 FY to around 24 days in 2023/24 FY. This is less than the equivalent days’ of payables that Sainsbury’s owes its suppliers, meaning, in principle, Sainsbury’s can turn the inventory received from its suppliers into cash before it needs to pay its suppliers for that inventory. Sainsbury’s has to extend very little credit to its customers, generally receiving cash from the sale of its goods within 1 - 2 days of recognising the revenue sale.
Equivalent days of receivables and payables are calculated by dividing the financial value of receivables (or payables, respectively) by revenue and multiplying by 365. This provides the proportion of revenue held as receivables (or payables), scaled by the number of days in the year. Days of inventory is calculated similarly, but I use cost of goods sold, adjusted for depreciation and amortisation, instead of revenue.
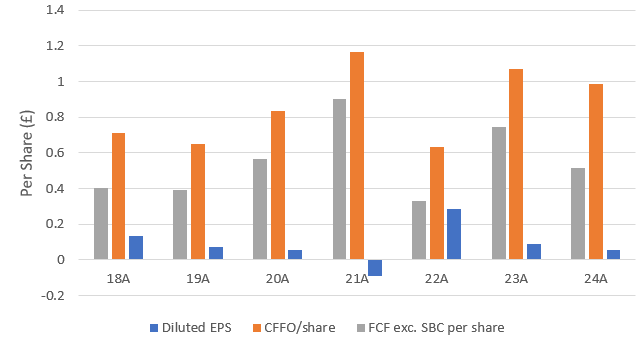
The marked difference in statutory earnings compared to cash flow from operations (CFFO) or Free Cash Flow (FCF, calculated as CFFO minus net CapEx) is shown in Figure 6, below. Figure 6 shows the company has roughly 50p per share available after net capital investment to utilise, but also that it has only 5p - 8p per share of statutory earnings, on average. The major source of the discrepancy is depreciation and amortisation expenses. Current net CapEx levels are only around 88% of combined depreciation and amortisation expenses, so it is feasible that CapEx may need to increase in the future, unless Sainsbury’s can improve its business to achieve its returns with fewer capital assets.
With a dividend of 13.1p per share, it would initially seem that the dividend is unsustainable, paying out roughly twice statutory earnings. However, paying the dividend is costing Sainsbury’s a little over £300M per year, which is only around one quarter of current total FCF and around one half of retail FCF. Although the dividend has historically been higher than it is currently, at the current level it still represents a 5% compounded annual growth rate (CAGR) over the last 5 years. In the 2023/24 preliminary results presentation, Sainsbury’s have committed to a progressive dividend. As outlined in the strategy update in February 2024, Sainsbury’s will also spend £200M on a share buyback scheme in the coming financial year, which is around 3% of the outstanding share capital at the current market capitalisation at 261p per share. A £300M dividend and £200M share buyback shows that Sainsbury’s intend to distribute the vast majority of their targeted £500M of retail FCF to shareholders, rather than increase cash holdings or pay down debt.
13.1p dividend on a share price of 261p is a yield of 5%, which, coupled with a 3% reduction in shares outstanding, implies around 8% shareholder returns over the coming financial year.
Returns on Capital
Please note: My calculations for Return on Capital are different to Sainsbury’s internal calculations. I keep my calculations consistent across all stocks I analyse, whereas each company may have their own definitions and adjustments for each of the parameters used in these calculations.
With the very low profit margins, my calculated statutory Return on Invested Capital (ROIC) is around 3.2% for 2023/24 FY, which is close to the 5-year average of 3.3%, but is an increase from the 3% observed in 2022/23. On an adjusted basis (with my own adjustments), I believe adjusted ROIC is around 13%, considerably above the 9% seen last year. The 5-year average adjusted ROIC is also around 9%. A large reason for this increase is that Sainsbury’s significantly reduced their lease exposure over the last year and increased their cash holdings, both of which reduced the level of invested capital.
I calculate Return on Capital Employed (ROCE) on a statutory basis (which simply uses EBIT, total assets and current liabilities) to be close to the 5 year average of 4%, but on an adjusted basis, adjusting for Capital Expenditure amongst other factors, I believe ROCE is now over 14%, compared to a 2022/23 and a 5 year average of around 11%. In their preliminary results call, by Sainsbury’s calculations, ROCE has increased from 7.6% to 8.3% over the last year, with a commitment to increase it further in the coming years.
As the Return on Assets (ROA) is close to 5 year averages, at around 0.5% unadjusted and 3% adjusted, I believe the improvements in ROIC and ROCE show that it isn’t just having the assets themselves that is improving Sainsbury’s profitability, but specifically Sainsbury’s capital allocation across debt, leases, CapEx, restructuring expenses and impairments, etc.

Figure 7 shows Sainsbury’s have markedly increased the adjusted returns on capital over the last couple of years, which I believe bodes well for the future.
Sainsburys vs Tesco
How does Sainsbury’s stack up against the market leader? I’ve used ROIC.ai to get some direct results for the two companies. Of course, this won’t have my calculations or adjustments, but ought to provide a basis for comparison.
Figure 8 shows that Sainsbury’s generally has had the better gross margins, but lower operating margins and net profit margins. Note that the exceptionally high net margin shown by Tesco in 2021 was due to disposal of their Thailand and Malaysia operations - excluding this exceptional item, net profit margin would have been 0.9%.
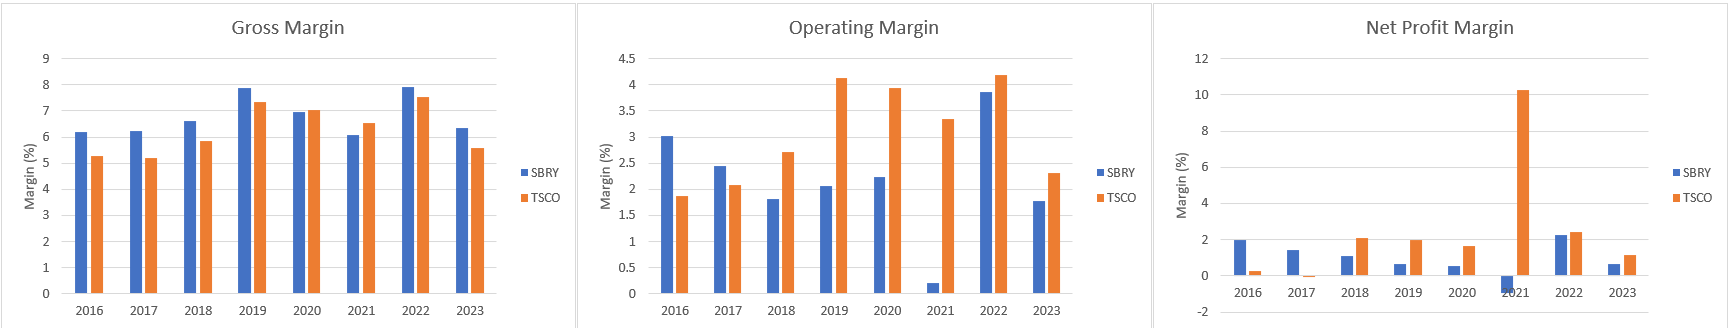
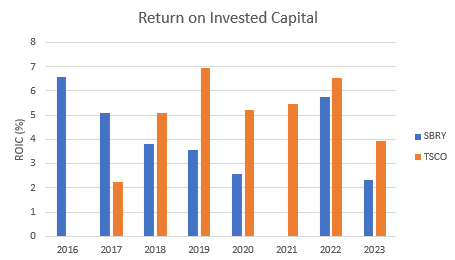
Figures 8 and 9 shows there has been something of a shift in profitability from Sainsbury’s before 2018, to Tesco since 2018. Tesco does seem to be able to better utilise its capital currently, indicated by higher profit margins and higher ROIC.
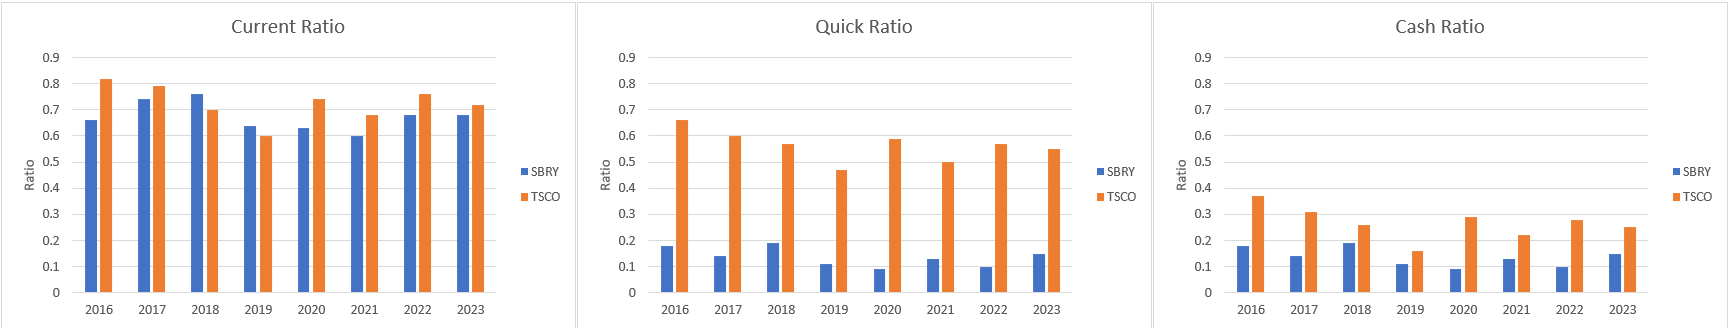
Generally, Tesco has the better liquidity, as shown in Figure 10. Tesco seems to have a lot more receivables than Sainsbury’s, explaining the difference in Quick Ratio. However, debt/equity is around 123% for Tesco, while it is around 98% for Sainsbury’s.
Without adjustments, the data from ROIC.ai shows much more variability in Sainsbury’s Cash Conversion Cycle. Generally, Tesco appears to have better control of their working capital than Sainsbury’s, with fewer days of receivables, fewer days of inventory and (generally) more days of payables. Comparing Figure 5 to Figure 11, my calculations generally provide a smoother cash conversion cycle picture than ROIC.ai, implying the adjustments may provide a clearer picture of the underlying business (as intended!).

According to Yahoo!, both Tesco and Sainsbury have Forward Price/Earnings multiples of around 11 - 12, Tesco’s dividend yield is 4% vs. Sainsbury’s 5%, Price/Book is 1.73 vs. Sainsbury’s 0.9 and Price/Sales is 0.3 vs. Sainsbury’s 0.2. Sainsbury’s PEG ratio is around 0.4, while Tesco’s PEG ratio is over 3.
In short, Sainsbury’s seems to be the cheaper stock, but Tesco appears to be the better business currently. However, I expect Sainsbury’s to continue to make improvements to their business over the coming years, so we shall see if these trends continue.
The Future
Under their “Food First” strategy, customer growth has outstripped that of competitors and the market at large, and Sainsbury’s has become a destination for bigger shops. Taste The Difference volumes have shown strong Year-on-Year growth through each quarter of the most recent financial year, aligned with new product launches. Sainsbury’s currently has achieved its highest value perception in the last six years. Under the “Next Level Sainsbury’s” strategy, Sainsbury’s intends to increase the number of stores offering a wider range of Sainsbury’s food products and revamping the store layouts to increase the space for fresh food, improve signage and use of digital screens, and upskill employees to offer better service [2].
The “Next Level Sainsbury’s” strategy aims to leverage the Nectar360 digital platform to drive growth, and Sainsbury’s are already able to boast partnerships with Channel 4, Sky, Google and Meta, WPP (the advertising agency founded by Martin Sorrell) and, recently, the Trade Desk. Sainsbury’s expect £100M of additional profit by the end of the 2026/27 FY, which implies something like a 15% CAGR in operating profit.
Since the launch of the “Food First” strategy, standalone Argos stores have reduced by roughly two thirds, while the number of Argos locations within Sainsbury’s stores have increased by around 45%. Collection points have increased by around 62%, and profits are around 3 times higher than prior to that strategy roll-out. Under the “More Argos, more often” element of the “Next Level Sainsbury’s” strategy, stores will be clustered into six types, rather than a ‘standard’ single type as used currently. There is a stated intent to drive more online traffic and improve the online offering to drive growth [2].
Structurally, Sainsbury’s expect to make savings over the next 3 years through end-to-end process improvements, improvements in the retail offering (which I expect to include the reduction in lease liabilities when real estate ownership appears preferable), and optimisation of logistics operations, including increased automation and use of machine learning in the supply chain [2].
The Bottom Line
Sainsbury’s feels to me to remain to be a good defensive stock. Strategically aligned to shareholder returns of around 8% per year or better, it seems, at face value, to be a better value stock than Tesco, although Tesco may well be the stronger company currently. There are no obvious trends of concern that I can see, with Sainsbury’s generally appearing stronger now than it was before 2020. ROIC and ROCE, adjusted for exceptional and non-cash items, show improving trends and strong returns, in excess of 10%. However, ultimately this industry has extremely thin margins and Sainsbury’s, in particular, has relatively high interest payments.
I am comfortable with Sainsbury’s current strategy and the results seen over the period of the prior strategy (2020 - 2023). Consequently, I see no reason to sell my holding at this time, but I want to keep a close eye on the cost base over the coming years, most particularly SG&A expenses. I hope to see a reduction in interest payments and continued improvements in total debt, coupled with improvements in profit margin as the new strategy takes hold.
References
https://www.kantar.com/uki/inspiration/fmcg/2024-wp-british-grocery-price-inflation-slowdown-stumbles
https://www.about.sainsburys.co.uk/~/media/Files/S/Sainsburys/documents/reports-and-presentations/2024/Preliminary%20Results/J%20Sainsbury%20Plc%20Preliminary%20Results%202324_Presentation.pdf
https://www.about.sainsburys.co.uk/~/media/Files/S/Sainsburys/documents/reports-and-presentations/2024/sainsbury-plc-preliminary-results-2324-transcript.pdf
https://www.about.sainsburys.co.uk/~/media/Files/S/Sainsburys/documents/reports-and-presentations/2024/Preliminary%20Results/J%20Sainsbury%20Plc%20Preliminary%20Results%202324%20Statement.pdf