
Deep Dive: Taylor Wimpey
Refreshing my valuation on major UK housebuilder, Taylor Wimpey

I last valued Taylor Wimpey (LON:TW) after their 2023 1st-half results, so it’s been a little while since I last ran a full valuation. 2025 has also not been kind to UK housebuilders in general, and at the time of writing, Taylor Wimpey is down 23% year-to-date and almost 32% over the last twelve months. Is Taylor Wimpey therefore more or less attractive to buy now than when I opened my position?
Disclaimer: This article is intended for information only and should not be used as the basis for any investment. I am not a financial advisor and nothing I say should be considered financial advice or a recommendation to buy or sell. Opinions expressed are my own and, although I have made best efforts to ensure the accuracy of any data expressed, I cannot guarantee this article is free of error. At the time of writing, I hold shares in Taylor Wimpey.
Why have UK Housebuilders been punished in 2025?
2023 saw the end of the UK’s decade-long “Help To Buy” scheme1, whereby the UK government would extend an equity loan, typically for 25 years, to first-time-buyers of up to 20% of the value of a home (40% in London) at very attractive interest rates. This scheme helped to keep homes more affordable than would otherwise have been the case, meaning demand for homes remained high, which in turn supported high house prices.
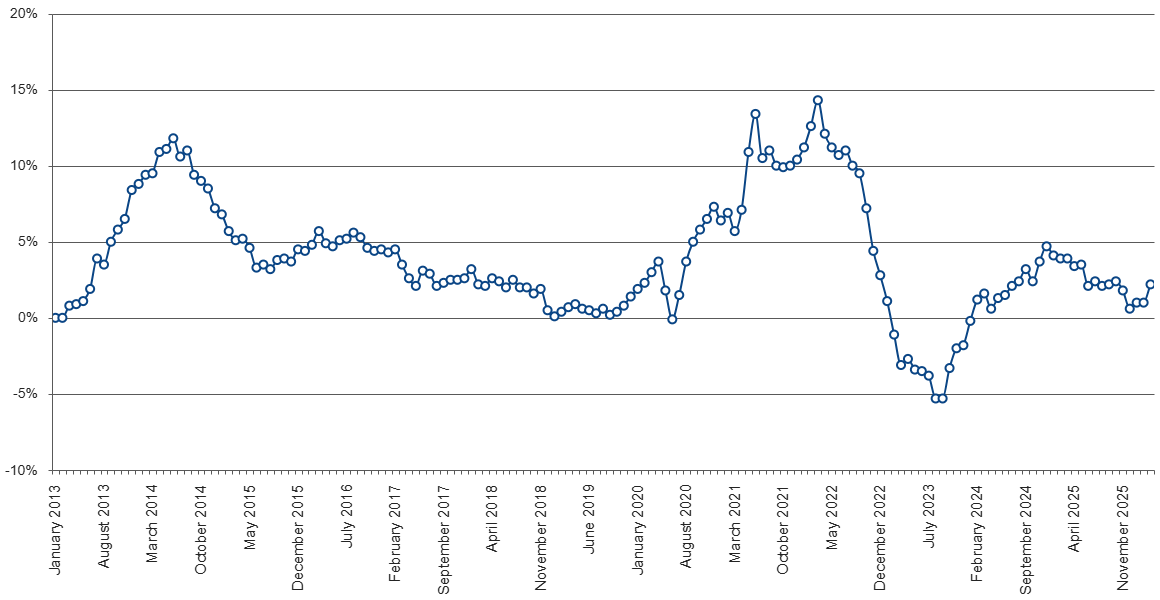
The scheme helped to maintain a flow of new entrants on to the housing ladder, and could be considered a win-win as the government would benefit from revenue if house prices continued to rise and homeowners paid back their equity early (triggered when houses were sold or if homeowners simply wanted to clear their debt). However, the scheme also helped enabled house prices to remain high, relative to real wage growth. The figure below shows that annualised house price growth reached over 10% on an annual basis over the course of 2013, and also had a significant boom in 2021/2022 in the aftermath of the pandemic, when space became very highly valued after lockdown. Following that boom, and at the time Help to Buy was withdrawn, house prices actually fell through 2023, the first time in over a decade that prices had dropped.
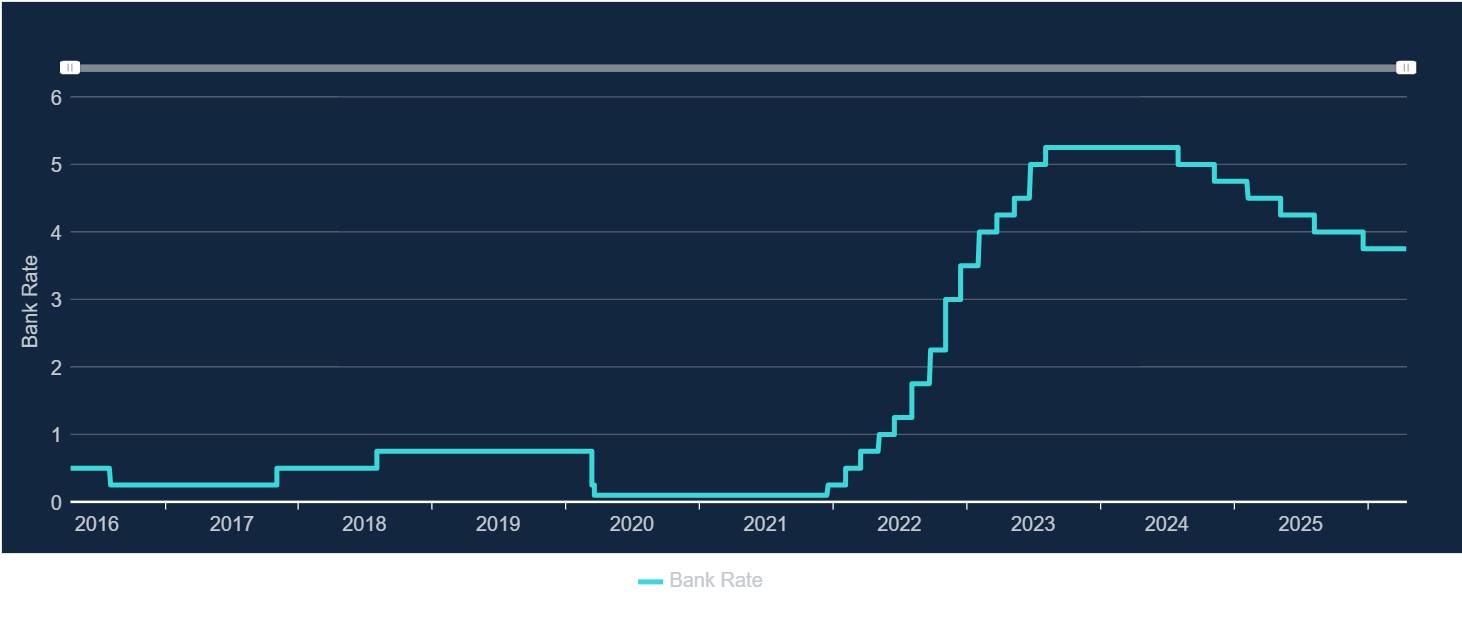
At the same time, the Bank of England increased its base rate from historical lows in December 2021 until August 2023 in an effort to tackle rampant inflation in the aftermath of COVID and the Ukraine invasion, directly impacting the mortgage rates available and home affordability recently.
In part due to these market forces, house prices rose from 4 to 5 times average earnings through 2013, and remained at that level for most of the next decade, peaking at 5.8 times average earnings in 2022.
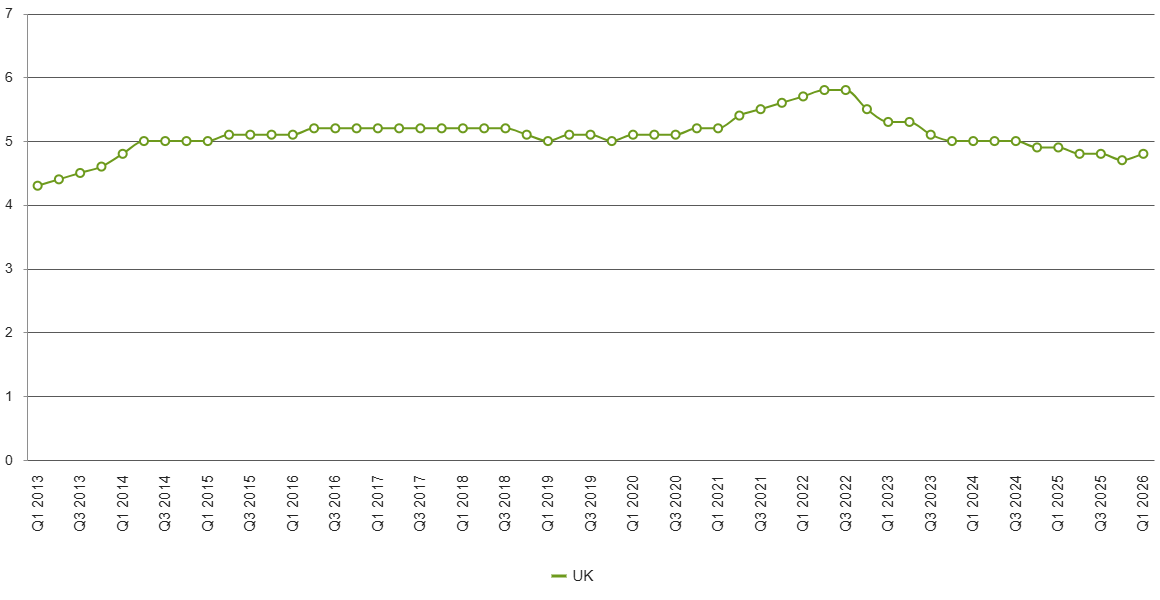
The rate raising cycle brought prices back down to 5 times earnings by early 2023, and house prices subsequently came down to 4.7 times average earnings by the end of 2025 - still high by historic standards, but the most affordable houses had been for a decade. As of 2026 Q1, first-time buyers were spending 32% of their take-home pay on their mortgages, which is still slightly higher than the long-run average of 30%2.
Competition and Markets Authority
In February 2023, concerned with consistently high house prices and strong profits being reported by the UK’s large housebuilders, the Competition and Markets Authority launched a market study into the industry3, focussing on the 11 largest housebuilders who collectively accounted for around 40% of homes built in Great Britain (intentionally excluding Northern Ireland). The market study concluded in February 2024.
The housebuilders investigated were:
Barratt Developments (now Barratt Redrow, LON:BTRW)
Bellway (LON:BWY)
Berkeley Group (LON:BKG)
Bloor Homes
Cala
Crest Nicholson (LON:CRST)
Miller Homes
Persimmon (LON:PSN)
Redrow (now merged with Barratt and de-listed)
Taylor Wimpey (LON:TW)
Vistry Group (LON:VTY)
This market study found that the market was not serving consumers well, with less innovation than may be expected, housing supply significantly below targets and companies building strategic (undeveloped) land banks, with periods of excessive profits (judged as periods where corporate profits were materially higher than the cost of capital). However, the study also concluded that housebuilders were not generating excess profits consistently. Many housebuilders saw profits considerably below their cost of capital in the aftermath of the Great Financial Crisis (2008 - 2013), and the CMA determined that corporations were not holding on to undeveloped land for an unreasonably long period, given the speculative nature of house building in the UK (building properties for sale before demand had been established or orders placed) as well as the time and risks associated with planning approvals. Therefore, the market failings were placed at the feet of local and national government, specifically around planning approvals and their unpredictability, rather than with the private companies providing those homes directly.
Further, the study found that the larger housebuilders tended to deliver better profits than smaller housebuilders, and highlighted specific risks around the increasing involvement of private estate management companies for maintenance of facilities that have historically been provided by local councils.
However, following their investigation into the operation of the housebuilding market, the CMA felt there was a risk of anti-competitive practices, and opened a second investigation into 7 of the large housebuilders for sharing information in an anti-competitive nature4. As a result of this investigation, the relevant companies (Barratt Redrow, Berkeley, Bellway, Bloor, Persimmon, Taylor Wimpey and Vistry) agreed to settle the investigation in return for an approximate £100M payment in aggregate, to support the construction of affordable homes. Taylor Wimpey’s contribution to this £100M settlement was £18M.
Revenue
So how has TW’s revenue held up in the face of ailing consumer sentiment and increased economic pressure?
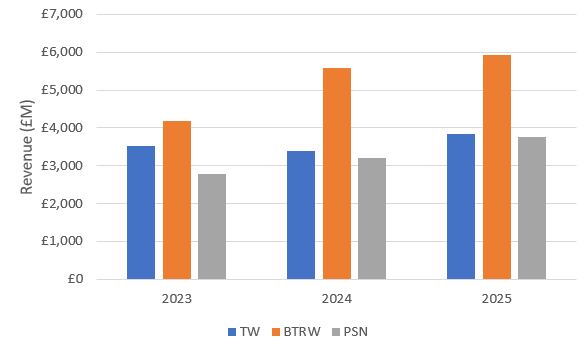
I’m going to focus on the top 3 housebuilders, as referenced by the CMA, namely Persimmon, Taylor Wimpey and Barratt Developments / Barratt Redrow (Barratt acquired Redrow in August 2024). Barratt Redrow’s end of year for reporting is in June, whereas both Persimmon and Taylor Wimpey report in December. In the results presented below, I have used the results from Barratt’s 2024 Financial Year to represent 2023, their 2025FY results to represent 2024 and the trailing twelve months’ performance (TTM) from their 2026 1st-half report (ending December 2025) to represent 2025. This does mean that there is a 6-month offset between TW/PSN and BTRW for the 2023 and 2024 results shown below, but the 2025 results are on a consistent time period across all three companies.
As a further note, the Redrow acquisition completed shortly into Barratt’s 2025FY. This means that Barratt’s latest results are not fully comparable to their earlier results, as the company is now substantially larger than it was at the time of those earlier reports.
Completions
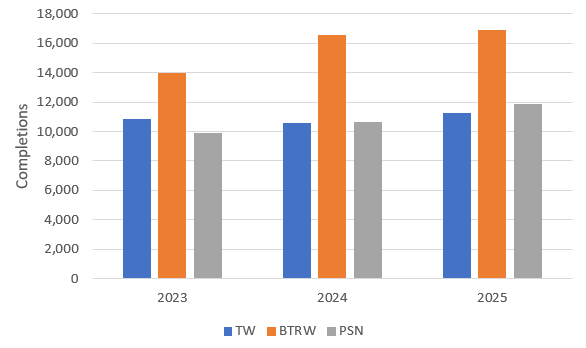
Taylor Wimpey has grown sales more slowly than either of its core competitors since 2023. TW’s sales have remained fairly stable, growing 1.7% per year on average, despite the more difficult trading environment. BTRW has achieved 13% annualised growth for the 18 months between June 2024 and December 2025, but completions have actually decreased by 0.7% per year on average since June 2023, meaning they are coming back from an abrupt slump. Persimmon, however, have achieved almost 10% annualised growth rate between December 2023 and December 2025.
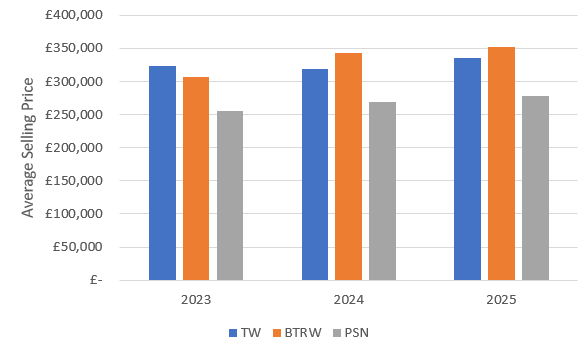
In terms of average price growth, Taylor Wimpey is again lagging its peers - both BTRW and PSN have grown average selling price by around 4% on an annual basis since 2023, whereas TW has only increased average selling price by around 2% over the same period. This may be explainable by virtue of TW having a higher average selling price in 2023, but with the amalgamation of Barratt and Redrow in 2024, BTRW now have the highest blended selling price. BTRW’s average selling price dropped 4% between June 2023 and June 2024, but has since been growing at an annualised rate of almost 10%. Persimmon’s average price remains at the lower end of the market.
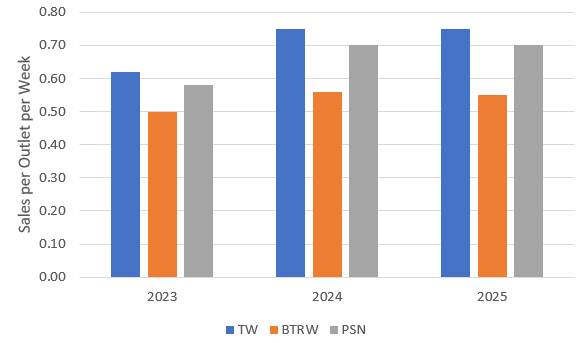
In terms of sales leads, TW seems to have an advantage, with TW’s average sales per outlet increasing by roughly 20% over the last 2 years, similar to BTRW and slightly ahead of PSN. TW also achieves more sales per outlet per week than either BTRW or PSN, perhaps implying a more efficient sales operation.
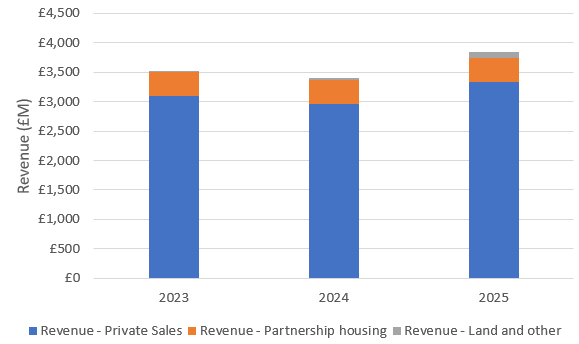
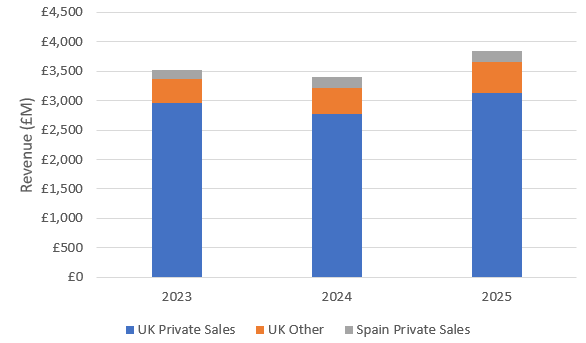
Taylor Wimpey’s revenue comes from three main sources - around 87% of revenue is from private sales (or sales to individuals), 11% comes from partnership housing and a small contribution (less than 3%) from land sales.
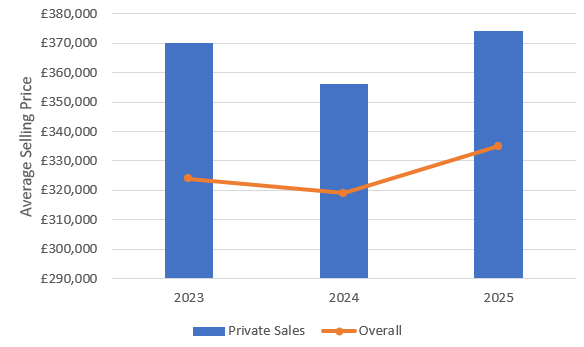
Taylor Wimpey’s average selling price growth has been driven by their partnership pricing. Common with their competitors, TW’s average selling price is higher for private dwellings than their blended selling price, but the blended selling price has grown faster than private sales since 2023 - the average selling price for private dwellings dropped in 2024 and, although it has since made back the lost ground, it has not increased much overall, compared to 2023.
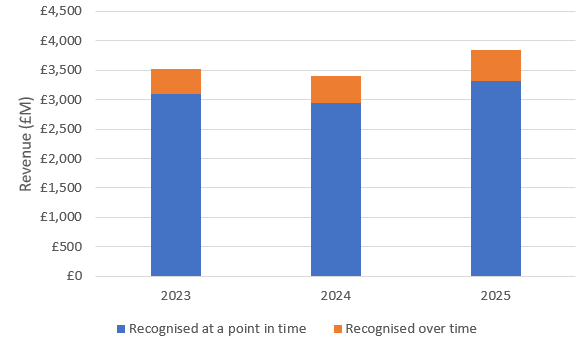
With the majority of TW’s revenue coming from private sales, the majority of TW’s revenue is also recognised at the point of sale, with only around 14% of their revenue being delivered over a period of time. This means TW will get some reliable revenue in subsequent years following a sale, but not much. Taylor Wimpey has a little under £1 bn of unsatisfied performance obligations, of which around half is expected to be recognised within 12 months of the reporting date.
Putting these facts together, although Taylor Wimpey appears to have reasonable and stable revenue, it also appears that Taylor Wimpey has lost ground to its peers over the last few years, particularly Persimmon. Barratt Redrow saw a significant drop in revenue between June 2023 and June 2024, so the results displayed below appear to flatter their true performance over the medium term, and results are somewhat clouded by the Redrow acquisition.
Profit Margins
Gross Profit Margin
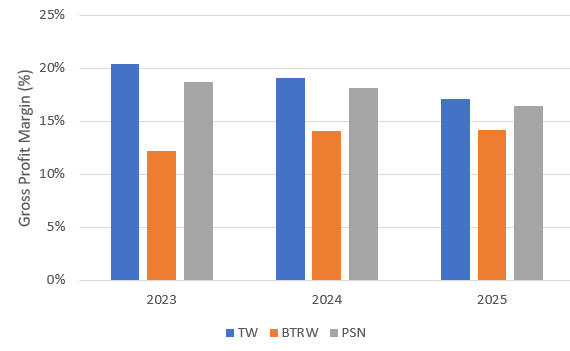
Despite revenue potentially not growing as quickly as some of their competitors, TW continue to enjoy the best gross profit margins of this competitor set. However, their advantage has narrowed relative to their competitors, meaning it may be getting harder to maintain high gross margins in the future.
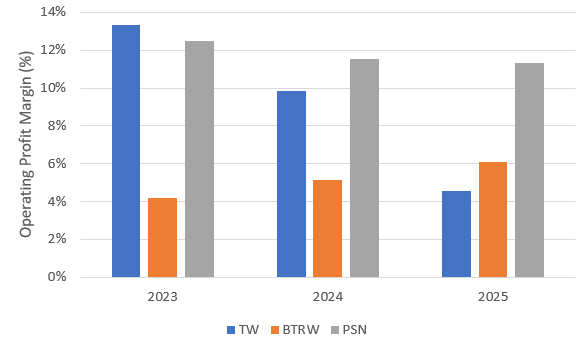
Operating Profit Margin
On the basis of operating profit margin before exceptional items, BTRW seems to be getting more profitable, while both Persimmon and Taylor Wimpey have been struggling in light of the changed market dynamics since 2023. Now, Taylor Wimpey and Persimmon are almost on parity, at around 11% each.
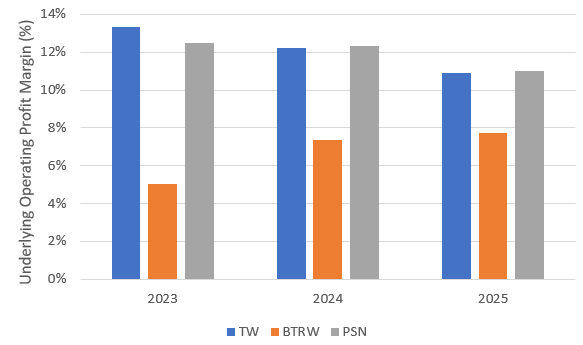
Considering statutory results, i.e. after exceptional items, Persimmon definitely appears to have a significant advantage. The large drop in TW operating profit margin from 2024 to 2025 is related to exceptional costs of over £240M, which were predominantly due to allocation of additional provisions for fire cladding remediation.
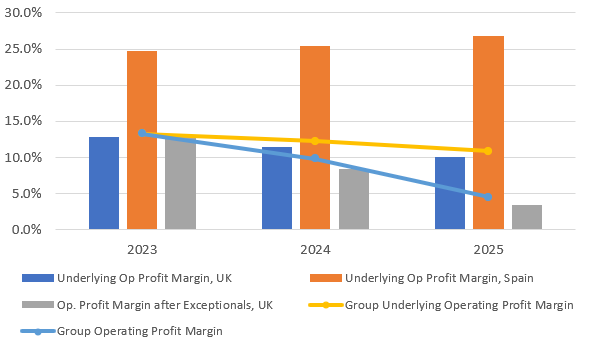
Segment Breakdown and Operating Margins
Taylor Wimpey has two segments, their UK business and their Spanish business. The UK business is the much larger segment, generating 7 to 8 times the revenue of the Spanish arm. The Spanish business is entirely private sales, whereas the UK business has private sales and partnerships.
Although Taylor Wimpey’s Spanish division is much more profitable than their UK business, because the Spanish arm is so much smaller, the Group’s profit margins are dominated by their UK performance.
Operating Expenses
Taylor Wimpey has two main operating expenses - the cost of goods sold, incorporating build cost, and their selling, general and administrative expenses. There are no significant research and development expenses to speak of.
Within the cost of goods sold (COGS), TW break out the cost of inventories (land and build cost), which has been around 95% of total COGS expenses each year since 2023. COGS (and the cost of inventories specifically) has increased by around 7% per year on average since 2023, whereas the annualised revenue growth has been less than 5%, causing the gross profit margin to compress.
Selling, general and administrative (SG&A) expenses have increased around 3% on average each year since 2023, a little below revenue growth, meaning these administrative costs have made a slight contribution to gross profit margin.
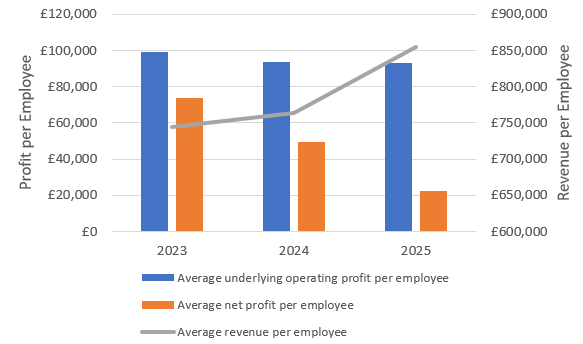
However, the average wage and average cost per employee (including social security payments and pensions) have each increased by around 5% on average over the last 2 years, meaning SG&A expenses have been managed by reducing the number of employees. Employee count dropped by about 5% between 2023 and 2024. Wages increased by almost 8% from 2023 to 2024, with a further 2% increase from 2024 to 2025. Overall employee costs were more evenly spread, with an almost 6% increase in 2024 and a little under 4% increase in 2025. Taylor Wimpey budgeted 3% for salary increases in 2025.
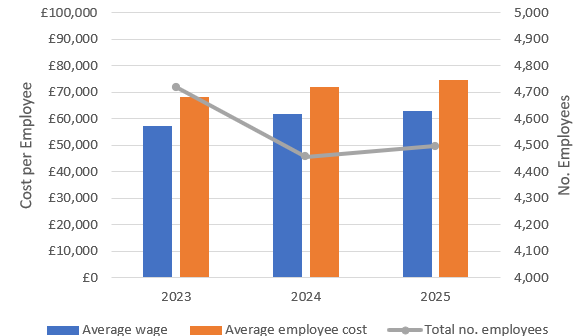
The reduction in headcount has not been enough to stabilise profit per employee, but profit per employee has dropped slightly less than than the overall profit reduction, indicating the headcount reduction has helped to keep operating expenses in check.
Inventory
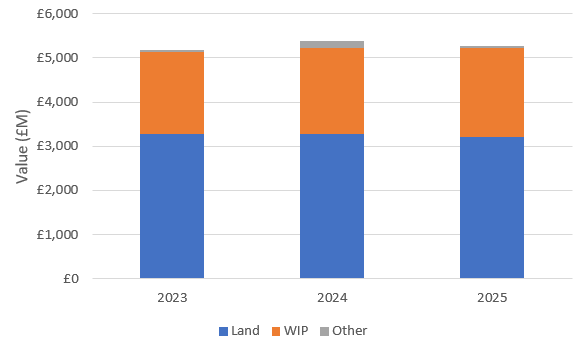
Common with other housebuilders, Taylor Wimpey has a large amount of land in its inventory (its land bank). Land makes up over 60% of the total value of TW’s inventories.
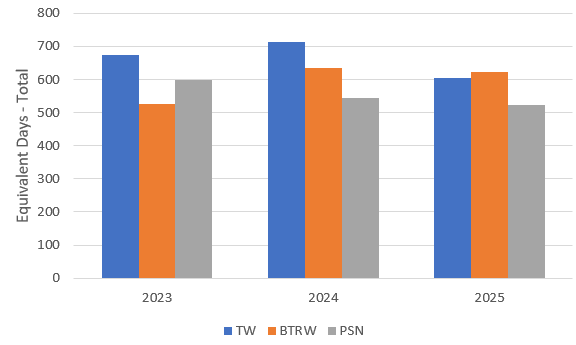
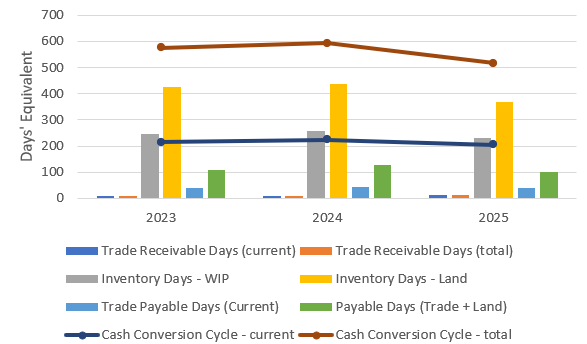
Converting this into days’ equivalent of COGS, Taylor Wimpey has a backlog of 8 to 9 months’ of buildings in progress, and it would take 12 - 14 months for TW to clear its land, if it had full planning approval for all plots and could progress them all without delay. In total, this means TW’s inventory will take several years to turn into cash, and therefore TW, like other housebuilders, requires a lot of working capital to maintain its operations. According to their annual reports, Taylor Wimpey’s land bank in 2025 is worth 7.2 years, but they have a medium-term target to reduce this to 4.5 - 5 years.
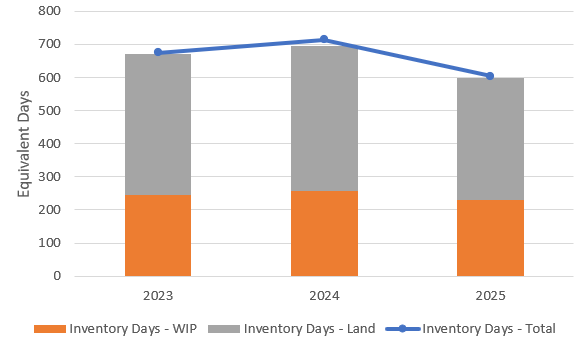
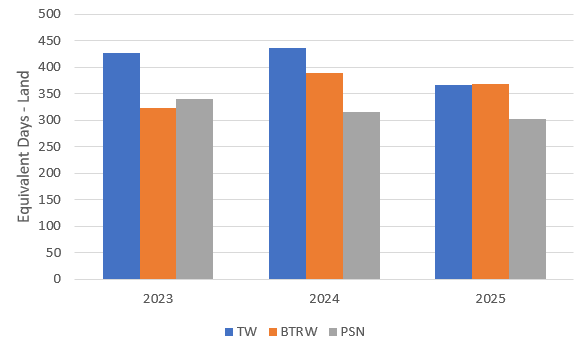
TW has typically had a larger land bank than either BTRW or PSN, relative to its COGS expenses. However, after some land sales in 2025, TW and BTRW now have very similar sizes in land banks, in terms of days of COGS. A large land bank has benefits and penalties - it ensures the ability to continue building in the future, regardless of the then-current land market, but also implies higher costs and working capital requirements.
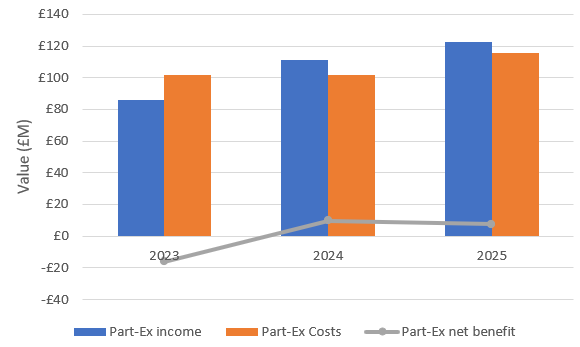
Apart from COGS and SG&A, the other primary element of operations is part-exchange income. However, the income and costs associated with part-exchange are broadly similar, and net out to only a small gain or loss. Although TW doesn’t explicitly quote part-exchange costs and income, it does state that the majority of its “other” income and expenses are due to its part-exchange business.
Debt and Finance Expenses
Many of the housebuilders treat their land banks as a type of debt instrument, by making arrangements with sellers to pay for the land over a series of instalments. This smooths cash flows and prevents the housebuilders having to access loans at commercial rates (or recording such financing arrangements as formal debt arrangements). This argument was made by some housebuilders to the CMA in response to their market study, but the CMA refused to accept land bank financing arrangements as being equivalent to a debt instrument. Nonetheless, I think it is important to reflect the cash arrangements for land creditors while discussing debt and finance income/expense.
Taylor Wimpey has three main finance expenses - interest payments on banks and loans, lease interest and depreciation payments, and payments to land creditors.
Under IFRS 16, lease expenses are broken into a depreciation charge for the right-of-use asset and an interest expense. This means the interest cost is only a part of the total annual lease expense. Land creditors are paid via both current and long-term payables, with an additional finance charge expensed each year to account for the unwinding of the present value discount rate, which reconciles the asset value and payable expense as the contracted term burns down.
Taylor Wimpey has a single debt instrument, Senior Loan Note, in issue, for €100M. Previously issued with a coupon of 2.02% and due to mature in 2023, between 2022 and 2023 TW rolled that Note into a new issue at a 5.08% coupon, due in 2030. As the loan is denominated in Euros, its fair value can change from year to year, based on foreign exchange rates. It is currently carried on the balance sheet at £87M.
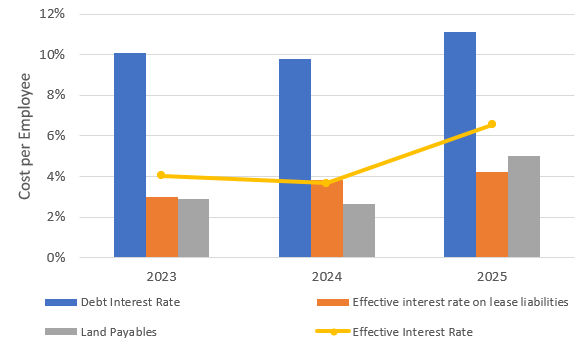
Although the coupon on that loan note is just slightly over 5%, TW’s interest payable on bank and other loans is 10% - 11% of their balance sheet debt, indicating additional financing costs. The Notes to their accounts reveal that TW have a revolving credit facility in place, which they accessed during 2025, however, similar effective interest rates were also seen in prior years, where the revolving credit facility was in place but not accessed.
I believe TW’s interest rate on their lease expense is around 3%. In 2025, lease interest expense was slightly over 4%, but the interest rate will appear to rise as the right-of-use assets and corresponding lease liabilities are depreciated. If prior depreciation is added back, the rate could be as low as 2% - 3%. It is difficult to judge exactly how much depreciation should be added back without knowing the duration of the individual leases, and the picture is clouded by the ongoing addition and disposal of leases within a financial year. Considering both depreciation and interest expenses, I believe the full annual cost of TW’s leased right-of-use assets is likely to be around 20% - 25% of the gross lease asset value, implying 4 - 5 year lease periods.
TW’s land creditor payables due in the next twelve months were £296M, non-current payables were £226M, and the unwinding of present value discounts cost TW a further £26M (accounted as a financing expense). The combined value of payables and discount unwinding was around £549M in 2025. For land valued at £3.2 bn in TW’s inventories, this implies overall land payable costs of around 17%. However, only the discount unwinding is a genuine financing expense, albeit a non-cash expense. The discount unwind is between 0.5% and 1% of the value of the land bank, and around 5% of the total land payables due.
Putting all of the above together, the effective weighted interest rate is around 7%, an increase from prior years in all categories.
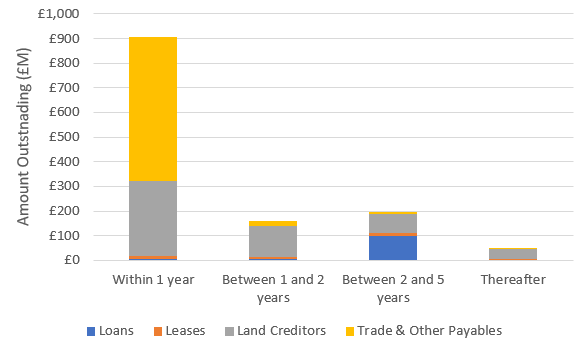
Taylor Wimpey’s debt maturity profile is fairly balanced. The vast majority of trade and other payables are due within the next year, with a small amount running into the longer term. Leases are a small proportion of TW’s overall liabilities, and TW’s land creditor payments are relatively evenly spread over the short and medium term.
Adjusting operating income for lease expenses, excluding land payables, TW’s interest cover on loans and leases is over 15 times adjusted operating income as of 2025, but this is down from over 47 times adjusted operating income in 2023.
Considering all sources of finance expense, including the unwinding of present value discount, interest cover in 2025 drops from 15 to 4, down from 19 in 2023.
This means that, despite the severe drops in the last few years, interest and finance expenses remain affordable for TW.
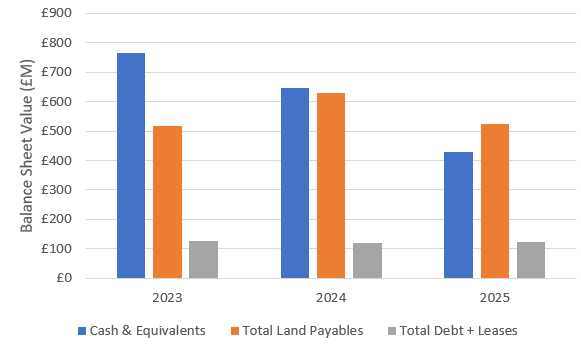
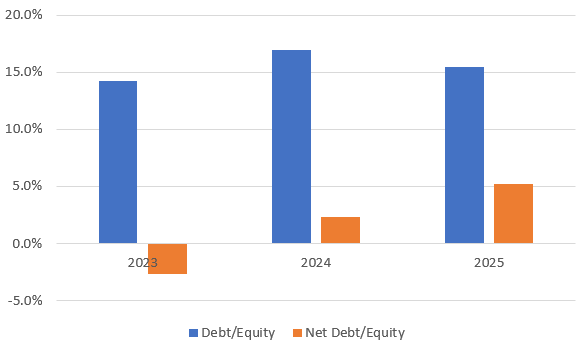
Taylor Wimpey’s debt level remains low, with a debt/equity ratio of less than 20%, even including future land payables (current and non-current). Recent reductions in cash mean the company now has a small level of net debt, whereas the company had more cash than debt in 2023.
Provisions
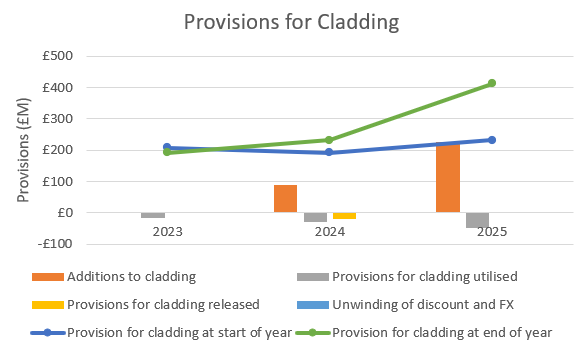
In the aftermath of the Grenfell tragedy and subsequent investigation, Taylor Wimpey, like many housebuilders, had to take remedial action on a number of its buildings. Consequently, there has been a large amount set aside as provisions for this work. There has also been provision made for leasehold assistance due to ground rent issues between leaseholders and freeholders.
In 2025, the cladding provisions were increased due to an increase in scope and re-assessment of historic buildings, following intrusive investigations with chartered fire engineers. Since the end of 2022, TW has expensed almost £314M to additional cladding remediation, meaning total provisions of over £522M have been made since the start of 2023. Against that provision, a cumulative amount of almost £110M had been utilised by the end of 2025, or a little over 20% of the total committed provision. TW expects to consume 35% of the remaining provision throughout 2026, meaning there will likely still be some provisions committed going into 2027.
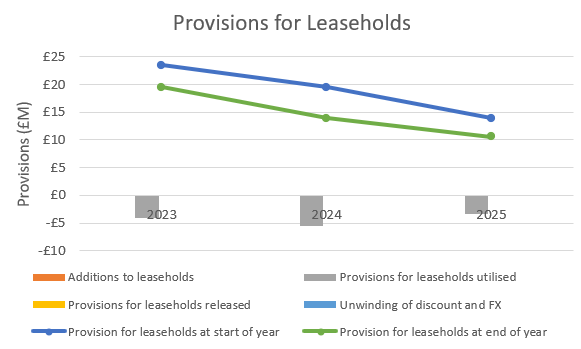
Leasehold provisions have been more straightforward - there have been no additions since 2023, with approximately 20% - 25% of the provision being spent each year on average.
2025 saw a relatively large increase in other provisions, predominantly caused by the £18M payment to CMA in response to their information-sharing investigation, and remediation required due to the actions of a principal contractor at one of TW’s London developments. “Other” provisions have been relatively well balanced from year to year, with TW having spent around 85% of the cumulative amount added since 2023. Taylor Wimpey have typically kept £60M - £70M set aside for “other” provisions.
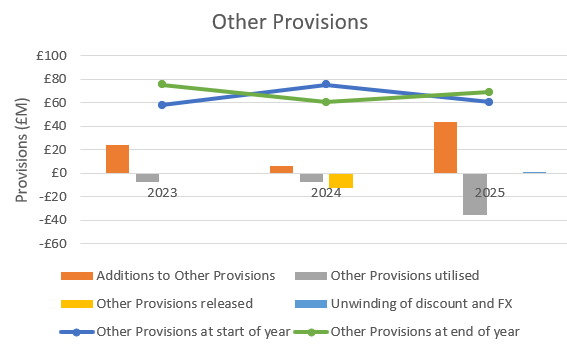
In 2025, the increase in provisions for cladding and the CMA investigation led to an exceptional expense of £248M, across operating and financing expenses.
Cash and Cash Conversion Cycle
The majority of Taylor Wimpey’s working capital is tied up in inventory. Receivables are very low, relative to the value of land and work in progress, while payables are considerably lower than work in progress. Generally, the majority of working capital is consumed with work in progress and with the land bank, offset somewhat by land payables. Taylor Wimpey need the best part of 9 months to turn invested capital into cash, and in total have almost 2 years of capital wrapped up in receivables, payables and inventory, mostly through land inventory and land payables.
Tangible and Intangible Assets
Housebuilders do not require much in the way of plant and equipment to run their businesses - they buy land, then buy in materials and turn those materials into goods for sale on site. Consequently, property, plant and equipment (PPE), including Right-of-Use (ROU) assets covered by leases, only accounts for around 1% of the total asset value on the balance sheet. Taylor Wimpey has no Goodwill, and Intangible assets, consisting of Brands and Software, have a carrying value of less than 0.1% of total assets. Even if considering intangible assets on a cost basis, i.e. ignoring amortisation, the total cost of intangible assets is less than 3% of the total asset value on the balance sheet. The effect of this is that TW sees very little depreciation or amortisation expense, relative to its other operating expenses, and requires little capital investment, aside from land, for its continued operations.
Cash Flows
Cash Flow from Operations
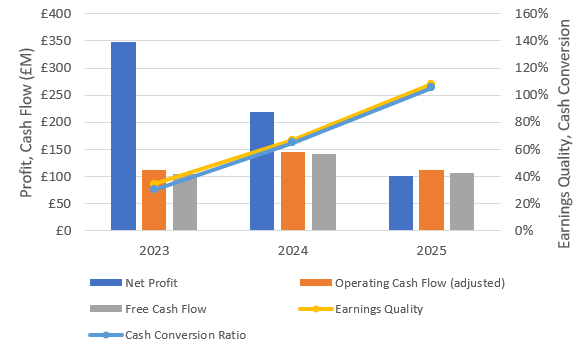
Taylor Wimpey is cash-generative and its cash from operations has broadly fluctuated between £110M and £150M over the last 3 years, after adjusting for lease expenses and share repurchases. Lease expenses are classified as a financing cash flow, however, I consider them to be operational expenses. Similarly, although there is a non-cash stock-based-compensation expense in operational cash flow, Taylor Wimpey also repurchases shares for its treasury to offset share options and shares granted under performance schemes. Although share repurchases are classified as a financing cash flow, in my opinion, managing share count is definitely an operational consideration, so I subtract the greater of the accounted value for SBC or the cash expended to hold share count constant from operational cash flow.
TW’s share repurchases have not quite managed to stabilise their weighted average shares outstanding, which has increased by around 0.1% - 0.2% per year on average since 2023. TW did undertake a substantial share buyback in 2022. Based on the cumulative cash spent since 2022 and the total change in weighted shares outstanding, Taylor Wimpey has spent over £6 on average for each share it has bought. This is considerably above the TW share price over that time, which has consistently been less than 180p. This demonstrates that TW’s SBC expenses are considerable, even if the numbers are small in absolute terms.
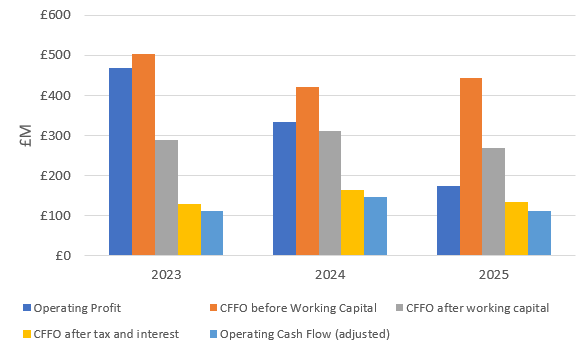
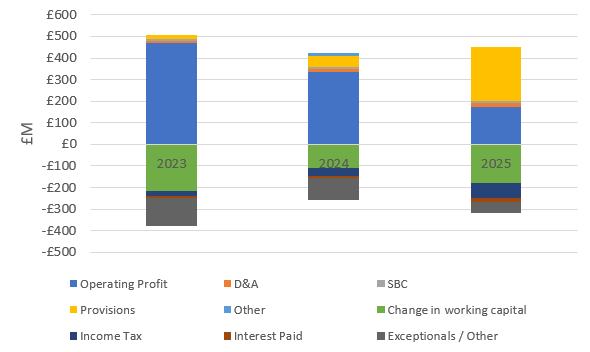
Of more concern to me, is that cash flow from operations (CFFO) is typically so much lower than operating profit, even if looking at operational cash flow before interest and taxes. It would be typical to expect CFFO to be higher than operating profit, as operating profit would include non-cash depreciation and amortisation expenses. However, as TW does not have large amounts of capital in PPE or intangible assets, it does not see large amounts of depreciation or amortisation.
The main reason that CFFO has been lower than operating profit over the last few years has been due to TW investing considerably more in working capital, split between an increase in inventories and from a decrease in payables due. The silver lining is that the without the exceptional charge to provisions in 2025, operating profit would have been similar to 2024, i.e. recent underlying performance looks consistent with the prior year.
Operating cash flow is also quoted after paying interest and taxes. Taylor Wimpey’s effective tax rate is currently running at around 31% - 32%, slightly ahead of the 29% that may be expected for typical UK corporation tax of 25%, plus the 4% Residential Property Developer Tax , introduced in 2022 as part of the government’s Building Safety Package to support the removal of unsafe cladding, following the Grenfell tragedy.
Free Cash Flow
Taylor Wimpey’s Capital Expenditures (CapEx) on property, plant and equipment and intangible assets has not been too significant over the last few years, and as a consequence, free cash flow has been similar to CFFO, from around £100M to just over £140M.
TW’s free cash flow has not closely matched its profits over the last few years. Although earnings quality5 and cash conversion ratio6 were close to 100% in 2025, in 2023, cash flows were less than 40% of earnings. The £250M difference between earnings and cash flows was almost entirely explained by changes in working capital, with around £150M spent on inventories and a reduction in payables due of over £100M.
This really highlights the importance of working capital management in this industry - working capital is often a very significant proportion of earnings.
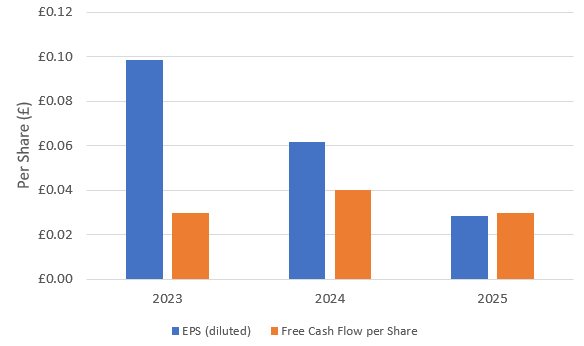
On a per-diluted-share basis, earnings per share (EPS) has dropped significantly since 2023, while FCF per share has been broadly flat since 2023 (increasing over 30% in 2024 before falling back by over 25% in 2025).
Return on Capital and Capital Allocation
Dividends
Taylor Wimpey, like many housebuilders, pays a substantial dividend. Their policy is different to some of their peers, in that their current shareholder returns policy states that they will return the higher of £250M or 7.5% of net assets to shareholders each year. That has been £330M - £340M per year over the last few years, which is clearly outstripping free cash flow of £100M - £140M or so. This means Taylor Wimpey has been having to dip into its cash balance to service its dividend, spending roughly £100M - £200M per year. At that rate, its cash reserves would be depleted in only a few years, especially considering TW needs to retain a considerable amount of cash due to its large working capital requirements. In reality, it is likely that TW would look at other financing methods to support its dividend and not rely wholly on its cash balance.
To cover dividends of £250M, at a 32% effective tax rate, allowing for some variations in interest and working capital, TW would need reliable operating cash flows of around £400M per annum. For dividends of £330M, given similar assumptions, operating cash flow would need to be more like £500M.
In March 2026, TW announced a slight modification of this dividend policy. Instead of returning the 7.5% of net assets to shareholders as cash, they have declared they will return a minimum of 5% as cash, with the other 2.5% to be returned as cash or via share buybacks, as determined by the Board at the time.
While this doesn’t in principle stop the company consuming its cash to service its shareholder returns, it could reduce the total cash distributed for dividends. For constant net assets, reducing returns from 7.5% to 5% reduces cash returns to share holders by one third, or over £100M at current payouts. Spending £100M on share buybacks at the current share price (at the time of writing, around 84p) would permit the company to retire around 120M shares, or around 3% of basic shares outstanding. This in turn will mechanically increase earnings per share (without increasing the absolute net profit or free cash flow). As TW’s current policy is to return an absolute quantity of cash, rather than an amount per share, a 3% reduction in share count should lead to an increase in earnings per share and dividends per share of a little over 3%, both of which could be expected to lift the share price similarly. If TW were to change their policy to relate to a dividend per share value instead of an absolute cash distribution value, the reduction in share count would directly translate to a reduction in cash outlay for dividends.
Return on Net Operating Assets
Given Taylor Wimpey’s stated dividend policy to return 7.5% of net assets to shareholders, it is important that TW achieve more than 7.5% return on their net assets. One of the metrics TW use is Return on Net Operating Assets (RONOA), which accounts for 15% of their executives’ performance share plan (although it didn’t pay out in 2025, as TW did not meet the hurdle rate of 14%).
TW calculates this based on adjusted operating profit, which includes contributions from joint ventures, but excludes exceptional items. This means it does not include the substantial provisions made in the last few years. TW’s Spanish arm generates very good profits at high margin on a very low net asset base, so its RONOA has increased from 38% in 2023 to 58% in 2025. However, it remains a small proportion of TW’s adjusted operating profit, so I have focussed here on the Group and the UK performance.
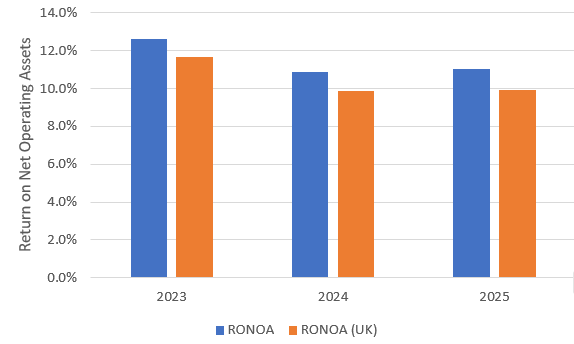
At 10% for its UK operations and closer to 11% for Group operations, RONOA is above the dividend payout ratio of 7.5%, but they are not equivalent metrics. By using net operating assets, RONOA does not consider all assets and liabilities. Overall net assets are typically between 10% and 20% higher than net operating assets, which will cause return on net total assets to be 9% - 16% lower than quoted RONOA. Put another way, return on total net assets would typically be between 1 and 2 percentage points below quoted RONOA.
Secondly, by using adjusted operating profit, TW are not considering their finance income or expenses or tax expenses, or the exceptional items, as mentioned earlier. Although TW’s net finance expenses are relatively low, their effective tax rate is in excess of 30%, which would be expected to feed through into return on assets, meaning the after-tax return on net operating assets would be about one third lower than the quoted RONOA. On quoted RONOA of 10% - 11%, after-tax returns could be closer to 6% - 7%.
With these adjustments, funding a dividend of 7.5% of net assets would require a RONOA of around 13%, very close to the performance share plan hurdle rate of 14%. This does imply that if TW can hit its internal targets, the dividend should be reasonably sustainable, aside from changes in working capital.
Return on Invested Capital
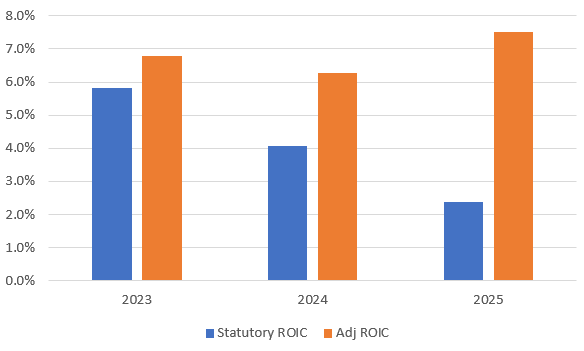
I have calculated Return on Invested Capital (ROIC) on two different bases: 1) straightforward statutory net operating profit after tax (NOPAT), including exceptional items and statutory balance sheet assets and liabilities, and 2) following something more similar to Michael Mauboussin’s framework for ROIC7, that addresses amortisation and depreciation differently (Mauboussin excludes amortisation and considers more expenses to be “invested”, with the intent to demonstrate a more comprehensive view on the success of the company’s capital allocation). I exclude exceptional items from my adjusted ROIC and, as per the Mauboussin framework, I also exclude the depreciation on leases and deferred tax expenses.
Taylor Wimpey has no Goodwill and low intangible assets, even before cumulative amortisation, so there has been very little investment written off. This contributes to a higher adjusted ROIC.
ROIC as calculated based on statutory numbers is poor, and reflects the high provisions made in recent years for cladding. Adjusted ROIC is higher (as expected, because it is considering fewer expenses than statutory earnings) and more stable, but is still low, sitting between 6% and 8%. As ROIC considers operating profit after tax this does imply that TW’s dividend policy basically returns all profit (or more) to shareholders. Therefore, the dividend policy does not provide much margin for a reduction in performance from here.
Executive Compensation
I think there is a lot to like about Taylor Wimpey’s Executive compensation policies. Firstly, their Executives’ salary increases are in line with salary increases for their staff, each budgeted at 3% in 2025. Secondly, Executives can invest in the exact same share purchase schemes (the Sharesave Scheme and Share Incentive Plan), on the same terms, as their staff, and pension contributions for Executives are also matched to contributions for staff, at 10% of salary. I personally very much like that TW is treating its Executives on similar terms to its staff.
There are two pay-for-performance schemes available to Taylor Wimpey Executive Directors, the Executive Incentive Scheme (EIS) and the Performance Share Plan (PSP). Taylor Wimpey has two Executive Directors, the CEO (Jennie Daly), and the Group Finance Director (Chris Carney). 2026 will bring some significant changes to these schemes, set out below.
Staff also get access to a bonus scheme, and get an uplift in the value of their bonus if they elect to invest their bonus in company shares and hold them for at least one year, something I think, again, keeps staff and executives aligned and personally invested in the future of the company. In 2025, 58% of employees were shareholders or were participating in employee share schemes, meaning they also had the right to express their opinions on Taylor Wimpey management via the AGM, like all other shareholders (although in 2025, 51% of shares were held by institutions, meaning retail investors collectively hold a minority stake in the company).
Currently, executives are required to have at least 200% of their salary in TW shares, although the Board is recommending this is increased to 250% of salary to offset some of the other proposed changes to executive compensation. Currently, Jenny Daly holds shares equivalent to 207% of her salary, while Chris Carney already holds shares equivalent to 300% of his salary.
Executive Incentive Scheme
The EIS pays out on a 1-year performance period, although one third of the payment is deferred into shares to be held for 3 years. In 2025, the EIS paid out at 53% of the maximum, down from a 94% payout in 2024.
The EIS pays out based on performance against the following metrics:
Adjusted Operating Profit (30% weighting). The 2025 target for 100% payout was £460M.
Adjusted Operating Profit Margin (20% weighting). The 2025 target for 100% payout was 11.5%
Cash Conversion (20% weighting). The 2025 target for 100% payout was 190%
Build Quality (15% weighting), based on the NHBC Construction Quality review. The 2025 target for 100% payout was 95% in the review.
Customer Service (15% weighting), based on the Home Builders’ Federation (HBF) survey. The 2025 target for 100% payout was 4.18 out of 5.
This means half of the bonus is based on operating profit and corresponding margin, 20% is based on turning those profits into cash, and 30% is based on quality and customer feedback.
The Board has proposed to increase the maximum payout under the Executive Incentive Scheme from 150% of salary to 200% of salary, and to increase the threshold for any payout from 10% of target to 25% of target. In other words, although the maximum opportunity is increased, so is the bar to achieve any payout. This proposal would move the CEO’s opportunity to the median for the market and would move the Group Finance Director’s opportunity to the upper quartile of the market.
Performance Share Plan
The PSP is Taylor Wimpey’s long-term incentive scheme for its Executives. The scheme grants executives shares, based on the performance over a 3 year period and, once vested, the shares must then be held for a further 2 years, meaning there is a 5-year period between setting targets and executives being able to realise profits on any shares granted against those targets. In 2025, the PSP vested at 70% of maximum against the targets set in 2023, up from 54% paid out in 2024 against the 2022 targets.
Taylor Wimpey has achieved a total shareholder return (TSR) of 33.4% for the period, putting it in the upper quartile of its peer group. Its peer group consists of:
Barratt Developments (now Barratt Redrow)
Bellway
Berkeley Homes
Crest Nicholson
Persimmon
Redrow (up to the point of acquisition by Barratt)
Vistry Group
The PSP scheme pays out against:
Adjusted Operating Profit Margin (15% weighting). This is the same metric as used for the EIS, although the targets are different. 100% payout for the PSP was 13%, vs. 11.5% for the EIS.
Return on Net Operating Assets (15% weighting). This did not pay out in 2025, as the threshold of 14% was not met.
Total Shareholder Return (40% weighting). This paid out fully if TW were in the upper quartile of peer group, which was achieved.
Customer Service (15% weighting). As with the EIS, this is also based on the HBF survey, but for the PSP, payout is based on the percentage of people positively answering the question, “Would you recommend?”. In 2025, TW scored 85.6% against an 81.5% target required for full payout.
Carbon Reduction (15% weighting). In 2025, this element of the scheme paid out fully, with TW having achieved a 60% reduction vs. a 2019 baseline, vs. a target of 38%.
The PSP scheme therefore rewards operational performance to a similar weight as share price performance (including dividends). I am very glad to see there is nothing to incentivise share buybacks directly (i.e. no metrics related to per-share performance or net profits), and I am pleased to see a high focus on total shareholder return.
The targets set for the 2026 PSP, due to pay out in 2028, are:
TSR between median (threshold) and upper quartile (maximum)
Adjusted Operating Profit Margin between 13% (threshold) and 16% (maximum)
RONOA between 14% (threshold) and 19% (maximum)
Customer service for period 2026 - 2028 between 12.63 (threshold) and 12.75 (maximum) in aggregate (which will later be converted into an annualised score out of 5)
Carbon reduction between 39% (threshold) and 48% (maximum)
As with the EIS, the Board is proposing that maximum payout under the PSP is increased, in this case from 200% of salary to 250% of salary.
These combined changes to EIS and PSP would move the CEO maximum remuneration potential from ~ £4M (which puts the CEO in the lower quartile of the 40 FTSE companies closest to Taylor Wimpey) to around £4.9M (which would put the CEO close to the median of the FTSE peer group), and would move the Group Finance Director’s maximum remuneration potential from around £2.5M (in second quartile of FTSE peer group) to around £3.2M (in third quartile of FTSE peer group).
With a maximum EIS payout of 200% of salary and a maximum PSP payout of 250% of salary, the amount of compensation at risk for TW’s Executives will be over 80% of their total maximum opportunity.
CEO Pay Ratio
As mentioned previously, Executive Director salary increases of 3% are in line with company-wide average salary increases. The CEO’s salary of £850k (consisting of a base salary of £836k and £12k of benefits, excluding pension) will increase to £875.5k. The Group Finance Director’s salary of £551.5k will increase to £568k, up from £545k in 2024.
The CEO’s total compensation in 2025 was £2.7M, of which £932k was fixed pay. The Group Finance Director’s total compensation in 2025 was £1.8M, of which £617k was fixed pay. This means, for both Directors, around 2/3rd of compensation was from “at risk” elements.
From figures quoted in the annual reports, the CEO pay ratio was 50:1 at the median employee salary of £42,123; 33:1 at upper quartile (salary of £65,857) and 67:1 at lower quartile (salary of £39,850). In 2024, the CEO pay ratio was 39:1 at upper quartile, 59:1 at median, and 68:1 at lower quartile, meaning employee wages are keeping up or rising faster than the CEO’s salary, which I think is good to see.
In general, I think these are good metrics - prioritising operational performance, keeping executives aligned with staff, focussing on shareholder returns and ensuring return on assets that ought to maintain a sustainable dividend, albeit one whereby substantially all profits are likely to be returned to shareholders.
Valuation 2025FY
So what does all of this mean for the share price and future prospects?
My biggest concern is around sustainability of dividends - I want to see how Taylor Wimpey will align dividends and share buybacks of over £300M per year with net cash from operations of closer to £150M per year currently. Working capital must be carefully managed in future years to square this particular circle.
But if I make some modelling assumptions, namely:
Revenue starting from between £3,400M and £3,800M per year, growing at between 1% and 4% per annum
Operating Profit Margin (inclusive of depreciation and amortisation) of 10% - 11%
Depreciation and amortisation expenses of 0.1% to 0.3% of total assets each year
An effective tax rate of between 29% and 31%
Capital expenditure of 0.1% to 0.2% of sales
A risk-free rate of 4.5% to 5% (aligned with current gilt yields at the time of writing)
Assuming TW has a beta value of 1 to 1.5 and the market continues to demand an equity risk premium of 6% to 7%
Debt/equity of 15% to 17% and a cost of debt of 7% to 11% (thereby providing allowance for land payables as well as corporate debt)
Return on Capital Employed of 6% to 7% and a dividend payout ratio of 100%
a terminal price multiple of 10 to 15
total debt of £647M and capital employed of £4,873M, of which £60M is subject to depreciation and amortisation expenses
3,549M shares outstanding
Then I believe a fair value for TW shares might be as low as 60p - 70p.
Achieving higher intrinsic value would likely require a lower risk-free rate and/or lower cost of debt to pull the cost of capital down, or a reduction in dividend payout ratio to permit more re-investment in the business. I’m not sure I see a path to either of those catalysts right now.
What might a bull case look like?
Here I have dropped the risk-free rate from a range of 4.5% - 5%, to a range of 4% - 4.5%, and dropped beta from 1 - 1.5, to a range of 0.5 - 1. All other assumptions remain the same.
Now a value of 80p - 90p, perhaps as high as £1 per share, looks more reasonable, even with growth of less than 4% per year over the medium term.
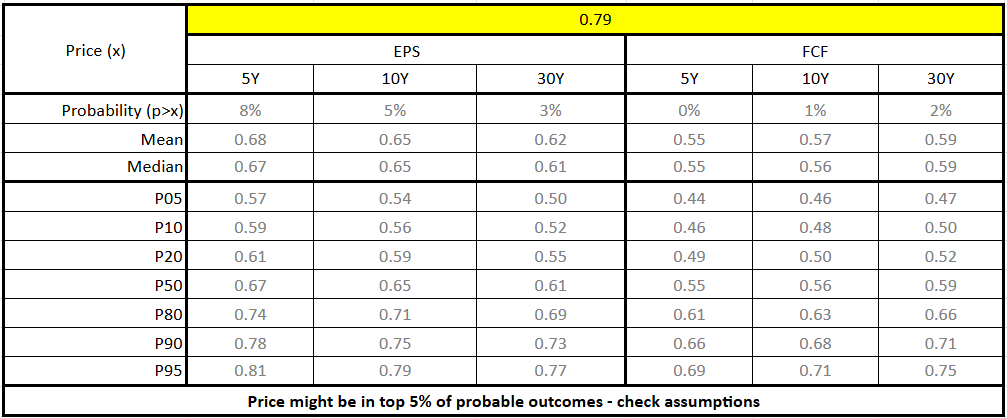
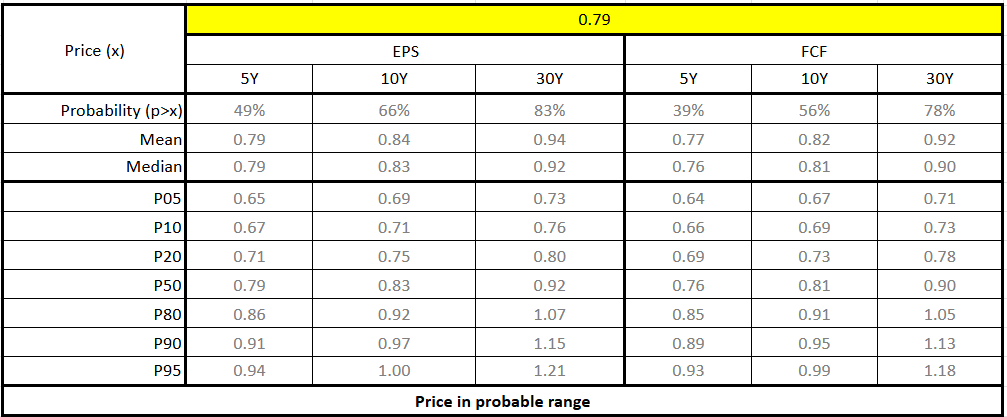
Conversely, for the same base assumptions, today’s share price implies average growth of 10% - 15% per year for the next 5 years, or around 10% per year for the next decade, or between 5% and 10% per year for the next 3 decades. These feel like aggressive, but not unparalleled, targets.
And then there’s the land value. TW has £3.2 bn of land sitting on its balance sheet, equivalent to 90p per share. Therefore, at current prices, you can basically buy the land at current value and get the company for free.
I personally believe a beta range of 0.5 - 1 is reasonable, as I see very little correlation between market indices and the UK housing market, which is much more sensitive to central bank rates, inflation and wage growth, than it is to general market performance.
In my opinion, at current values, Taylor Wimpey looks like a hopeful play on positive market dynamics, including a Bank of England rate reduction and increased mortgage demand or affordability. The current price is not unreasonable, especially considering the value of the land available to the company, but it does rely on some market catalysts to become good value currently without relying on unsustainable reductions in asset values.
I am happy to continue to hold, but I do fear there could be more short-term value erosion. I would also be interested in interrogating some of Taylor Wimpey’s competitors in more detail, in case a better opportunity exists.
cash flow from operations relative to equivalent earnings, in this case earnings after interest and taxes, but excluding depreciation and amortisation
free cash flow relative to net income
Excellent deep dive 👏🏼