


Head-to-Head: Ford Model e vs. Tesla
Is Ford's EV segment really that far behind?

Ford are one of the only ‘traditional’ OEMs to break out their Electric Vehicle (EV) business as a discrete segment (possibly the only OEM), and it’s no secret that they have been losing a lot of money in this segment since breaking it out. Now that they have two years of production under this segment (called “Model e”), I thought I’d look at how they compare to the undisputed leader in the pure EV space, Tesla. I’ve compared Ford’s Model e performance against Tesla’s Automotive segment performance on both a current-day basis, and against the 2015 - 2017 timeframe, when Tesla’s vehicle production was similar to Ford’s current level of EV production.
Revenue and Average Selling Price
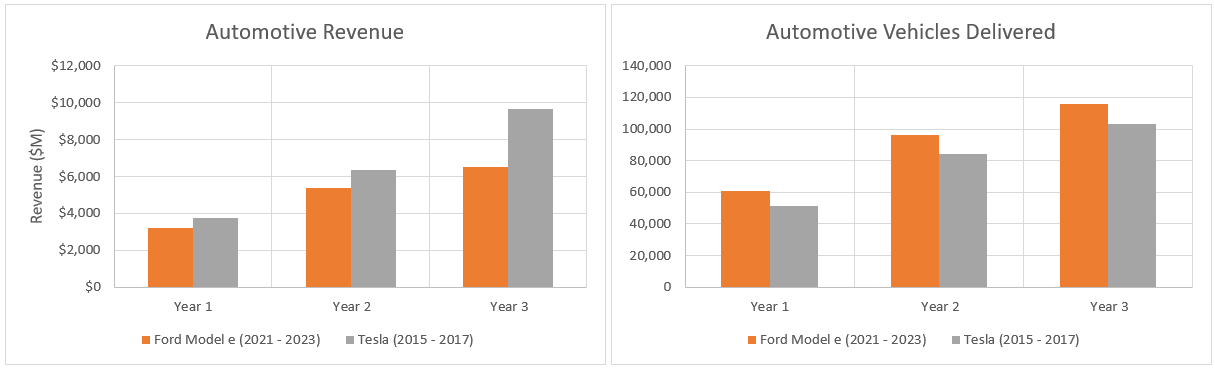
Of course, Tesla’s current automotive revenues dwarf those of Ford’s Model e segment, but then, Tesla sold over 1.8 million cars in 2023, vs. Ford’s Model e sales of 116,000. But looking at the delivery volumes of Ford’s Model e segment today against Tesla’s delivery volumes between 2015 and 2017, it can be seen that volumes and revenues are of a similar magnitude. Even though Tesla reached those volumes ~ 7 years ago, and even considering the inflationary pressures seen recently, Ford have not been able to generate as much revenue from their Model e segment today as Tesla were able to generate 7 years prior.
This is particularly clear when looking at the average selling price (ASP). At the time that Tesla were selling ~ 50k to 100k vehicles, their average selling price (automotive revenues divided by the number of vehicles delivered) was comfortably over $70k, rising to over $90k in 2017 before falling back to a little under $73k in 2018. By contrast, Ford’s Model e segment has only achieved an ASP of around $56k for the last two years.
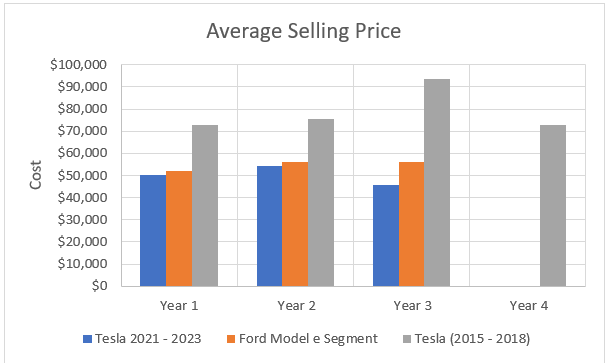
However, as also shown in Figure 2, Ford’s ASP is of a similar magnitude to Tesla’s current ASP. In fact, Ford’s ASP has been marginally higher than Tesla’s in 2021 and 2022, and considerably higher in 2023, when Ford were able to hold their ASP relatively steady while Tesla’s dropped to under $46k. Of course, a lower ASP ought to increase the size of the market for these products, reaching individuals who may otherwise have been priced out. One of the comments [CEO] Jim Farley made in Ford’s recent Q1 earnings call made explicit reference to this price elasticity (or inelasticity) - when Ford dropped the price of their Mach-E product by 17%, sales volumes increased 141%. Ford expect the majority of EV growth to come from urban consumers, for whom affordability is very important.
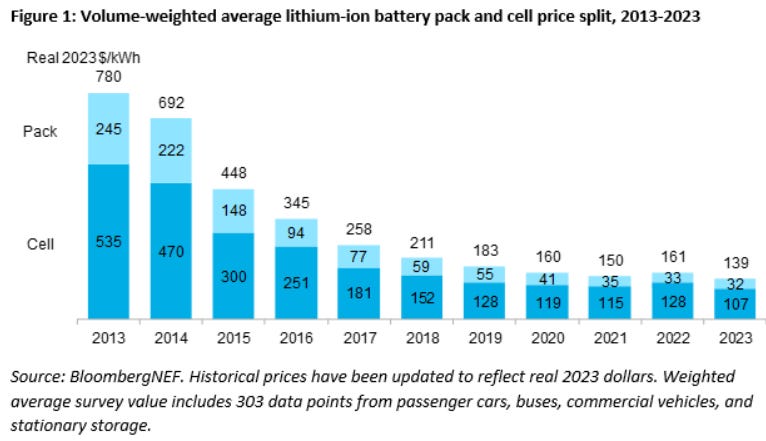
A major reason why the ASP has come down is, of course, the reduced cost of EV batteries, which have come down by around 80% in real terms between 2014 and 2023. This might explain why Ford’s ASP is close to Tesla’s current ASP.
Depreciation Expense
Of course, it is only possible to keep a low average selling price if the cost of manufacturing the vehicles is also low. Ford does not break out the cost of goods sold, research and development (R&D) expenses or selling, general and administrative (SG&A) expenses for the Model e segment, but it does provide depreciation, amortisation and impairment (D&A) expenses. I have compared these costs to Tesla, on both a present-day and similar-volume basis, below. N.B. I have added the cost of inventory write-downs to Tesla’s costs, as I view this as a form of impairment and I am not sure what is or is not included in the equivalent Ford numbers. In any case, the inventory write-down costs are small compared to the overall D&A expense for Tesla.
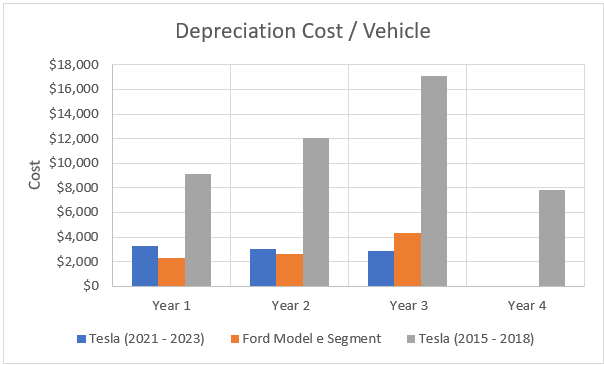
Ford’s D&A cost per vehicle has ticked up past Tesla’s in 2023, meaning Ford are now spending over $4k on every vehicle in D&A costs, while Tesla are now spending less than $3k per vehicle. However, in 2015 - 2018, Tesla had been spending between $8k to over $16k when they were producing the same number of vehicles as Ford are currently producing. So Ford’s depreciation costs really aren’t that bad, by comparison. Tesla saw a substantial increase in sales volume in 2018, helping to spread the depreciation cost over a much larger number of vehicles.
Related to depreciation costs, Ford break out capital expenditure (CapEx) costs for the segment. On a per-vehicle basis, these are really, really high, compared to Tesla and compared to the current level of depreciation expenses.
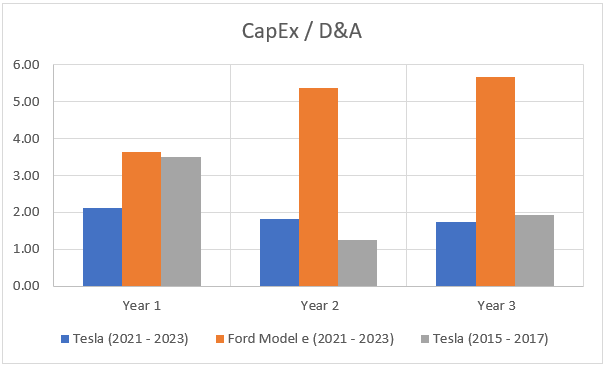
In 2015 - 2017, Tesla was spending 2 - 3 times as much in CapEx as it was accruing in depreciation and amortisation expenses. Today, CapEx spend is less than two times D&A expense, meaning Tesla is still effectively building out propery, plant and equipment. However, Ford’s CapEx spend is over 5 times their D&A expense! This indicates significant ongoing investment.
In absolute terms, however, it is clear that Ford’s Model e CapEx spend and total assets are still quite low compared to Tesla, either now or in the 2015 - 2017 window, which probably explains the very heavy investment by Ford currently.

EBIT Margin
So how does all of this shake out in terms of actual profit? Tesla benefitted from much higher average selling prices when they were growing their volumes in the range where Ford now finds itself, but Ford appears to have a benefit in terms of battery costs and depreciation expense (by virtue, in part, of having fewer assets assigned to its Model e segment).
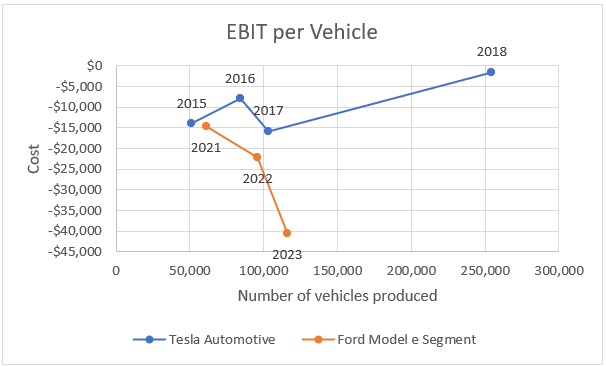
It doesn’t look good for Ford currently. Although their performance wasn’t too different to Tesla’s until this year, in 2023 they lost over $40k per vehicle, whereas Tesla were only losing around $15k per vehicle at similar delivery volumes. 2018 was a seminal year for Tesla - they more than doubled their delivery volumes and approached breakeven in terms of EBIT. Can Ford achieve similar?
So what has changed for Ford in the last 12 months? The short answer is that it is not only in the last 12 months. Ford’s cost base per vehicle has been degrading by around $15k per vehicle for each of the last 2 years. In their 2023 10-K, Ford essentially blamed the degradation on inflationary costs increases for material and freight, including some specific battery contractual obligations, as well as increased engineering spend on future programmes. In 2023, Ford also blamed higher launch and warranty costs. They made specific reference to launch delays in their 2024 Q1 earnings call, but they also pointed out that the Ford F-150 launch has seen less of a launch spike (number of defects) than prior programmes due to the changes Ford have made recently.
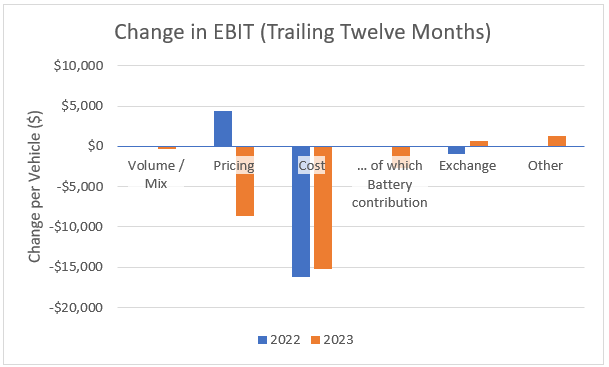
The other significant expense affecting Ford’s EBIT performance in 2023 was negative pricing moves. In the Q1 earnings call, [CFO] John Lawler highlighted that inventory had previously built up and, when prices were brought down to help with sales and competitive position, inventory prices had to be brought down, too, incurring around $300M of additional cost. This accounts for around 1/6th of the total ‘cost’ movement, or around $2.5k per vehicle. John also mentioned that, overall, he expects inventory moves to reverse in Q2.
The combination of pricing moves and vehicle cost increases since 2022 accounts for almost $24k of losses per vehicle.
Conclusions
Ford’s Model e segment, at a high level, doesn’t seem to be that much worse than Tesla was at a similar point in its development, but Ford’s losses per vehicle in Model e are substantial. In the Q1 earnings call, Jim Farley stated they expect every one of their EV models to make money within 12 months. So are Ford’s losses due to either exceptional items or new product launches, and should we expect a turnaround in Ford’s Model e profitability within the next year? That would fairly closely mimic Tesla’s experience, so maybe it is possible but, for me, the jury is out - I don’t know how Ford recover an almost $40k per vehicle EBIT loss with an average selling price of $56k within a year.