


Head-to-Head: ST Microelectronics vs. Infineon
Which silicon carbide company still looks best?

In June, I reviewed a number of analogue semiconductor stocks (here), including the stock I hold, ST Microelectronics (STM 0.00%↑). At the time, STM was my preferred stock, but it was very close between Infineon (DE:IFX) and STM. IFX had the stronger revenue and revenue growth, but slightly worse earnings and worse free cash flow over the preceding 5 years. STM also looked to me to have better inventory, debt and working capital management than IFX, and although I thought STM was delivering higher returns on its invested capital, I thought IFX was achieving higher returns on its capital employed. However, both companies were, in absolute terms, very similar.
I also felt that ON Semi (ON 0.00%↑) looked promising, but in many cases, ON’s performance seemed very similar to STM’s. On balance, I felt STM was the more robust stock for my portfolio and risk appetite, despite a poor first quarter in 2024.
I hold STM currently, I don’t hold either ON or IFX. But we are now a quarter further on since I last compared these companies and STM have had another poor quarter, and the share price has suffered. Do STM still seem like a wise investment?
Share price performance
Since the semiconductor shortage brought to public attention following Covid, of the three stocks being discussed here, ON Semi have achieved the highest total returns, showing a 239% return over 5 years, equivalent to a compounded annual growth rate (CAGR) of 28%, primarily since 2022. The last year has seen a downturn for all of these stocks, but Infineon seems to have avoided the abrupt drops experienced by ON at the end of October 2023 and STM in late July 2024 (Figure 1).
Despite having outperformed IFX slightly for the vast majority of this time, at the time of writing, STM is the worst-performing stock of the three over both one year and 5 year timeframes.


Revenue breakdown
One of the benefits of Finchat.io is access to segment data. However, at the start of 2024, STM re-organised their segments, now reporting 4 segments as two product groups. I found that Finchat.io picked up the product groups, but not the individual segments, so I reverted to STM’s quarterly earnings reports for this information (including the Appendix for 2024 Q1, where STM restated the previous year’s information against the new segments).

Figure 2 shows that IFX and STM had been fairly similar in terms of quarterly revenues until 2024, when STM began to lag IFX. 24Q1 experienced a particularly sharp drop, being almost 20% less than the preceding quarter. By contrast, although IFX had a slightly weaker end of 2023, its revenues in 2024 have held up much better.
Although ON Semi may still be worth a further review in the future, for me, there is not enough to differentiate ON from either STM or IFX as an investment currently. In addition, ON Semi has roughly half the revenue of either STM or IFX and its sequential revenue change is somewhere between that seen by IFX and STM, so for the rest of this article, I am going to focus on comparing STM and IFX over the last six quarters, primarily using data from Finchat.io (as this is the maximum period for data available without a subscription).
By looking at the segment breakdown in Figure 3, IFX’s dependency on the automotive segment is clear. Whereas STM segment by product type, IFX segment by end use. I personally find the end user segmentation easier to comprehend and understand sensitivity to industry trends. This means that, for me, it is easier to make a judgement on the risk exposure of IFX over STM, which is an important consideration for me, but by no means the only one (for example, STM still give an end use application breakdown in their earnings calls).
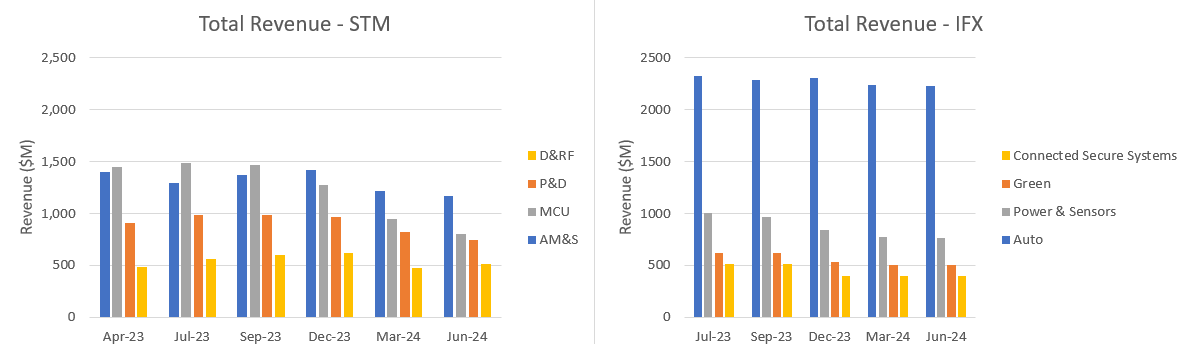
Looking at sequential growth (Figure 4), IFX have not really had any major growth areas over the last six quarters, but also, their sectors with greatest contraction are also those with the lowest revenue. In particular, IFX’s Automotive segment has held up well.
STM, by contrast, have shown periods of reasonable Digital IC and Radio Frequency (D&RF) segment growth, but have seen sustained contraction in their microcontrollers (MCU) segment. STM’s D&RF segment includes ADAS and infotainment products, while their MCU segment includes general purpose, automotive and connected security products. Both companies have seen contraction in power electronic components and sensors, and both companies seem to have had a particularly bad quarter, with subsequent quarters not showing the same level of declines.

Operating Expenses and Margins
From the Finchat.io data, STM was achieving gross margins of close to 50% in April 2023, whereas at the same time, IFX’s gross margin was below 47%. However, STM’s gross margin has fallen by more than IFX’s, meaning both companies are operating at around 40% gross margin now.

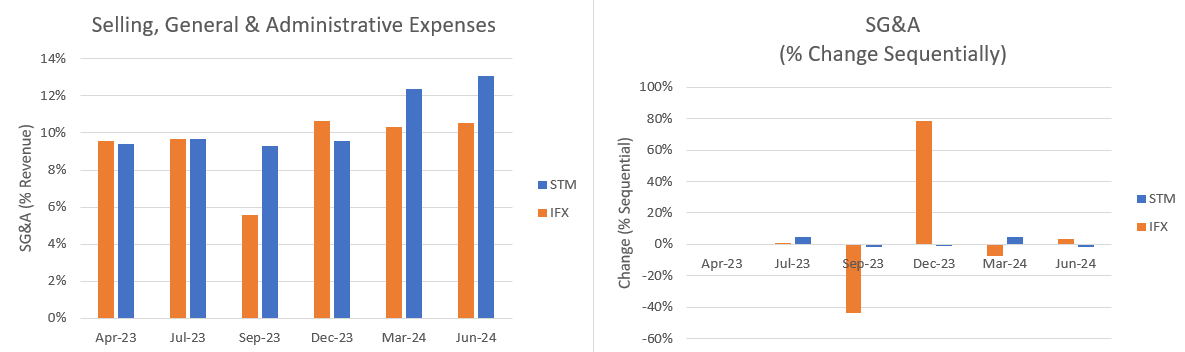
IFX had one quarter of low Selling, General & Administrative expenses (in September 2023), but except for that, SG&A expenses have varied by less than +/- 5% from quarter to quarter for both companies. However, while IFX have been able to maintain SG&A expenses at around 10% of revenue, with two sequentially poor quarters, SG&A expenses for STM have increased to around 13% of revenue.
Similarly to IFX’s SG&A expenses, STM had one quarter of low R&D expenses but, with that exception, R&D expenses across the six quarters have been within a +/- 10% range for both companies. Both companies have shown an uptick in R&D costs as a proportion of revenue recently, but STM are showing a bit less control of R&D expenses as their revenue has been significantly reduced in 2024.

Relating these revenues and operating expenses to operating income, Figure 8 shows that IFX has seen a more gradual decline than STM. STM’s operating margin dropped from 27% to 16% in one quarter, and has now fallen to 12%, 2 percentage points below the equivalent margin for IFX.
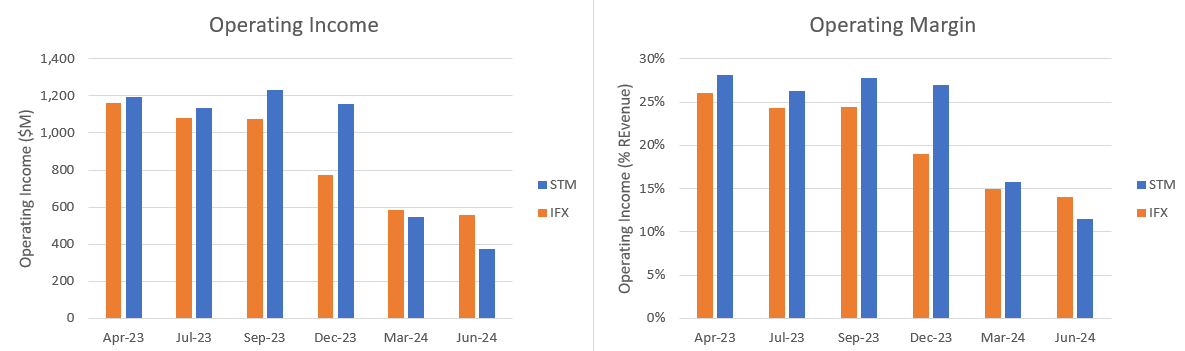
Net profit margins have showed an equally precipitous decline, with STM originally looking like the higher-margin company, but with both companies now posting net income margins of 11%. Neither company has shown a significant change in shares outstanding and diluted earnings per share change quarter-on-quarter were generally similar until March 2024, with STM faring slightly worse than IFX. However, by the June quarter IFX had broadly managed to stabilise their performance, while STM’s diluted EPS had dropped by a further 30% since April.
STM have now launched a $1.1bn share buyback, enough to buy back around 4% of shares outstanding at current valuations, which could boost EPS in the future.

Working Capital and Debt
Despite their woes, STM appear to be doing a better job of controlling their inventory than IFX, managing to reduce their inventory while IFX’s inventory is increasing. Relative to their revenue, although STM’s dollar of revenue per dollar of inventory is dropping (inventory turns reducing), it remains considerably higher than IFX’s turns on a trailing twelve month basis.

Inventory dominates the cash conversion cycle for both companies and, as a consequence, IFX has the longer cash conversion cycle than STM.
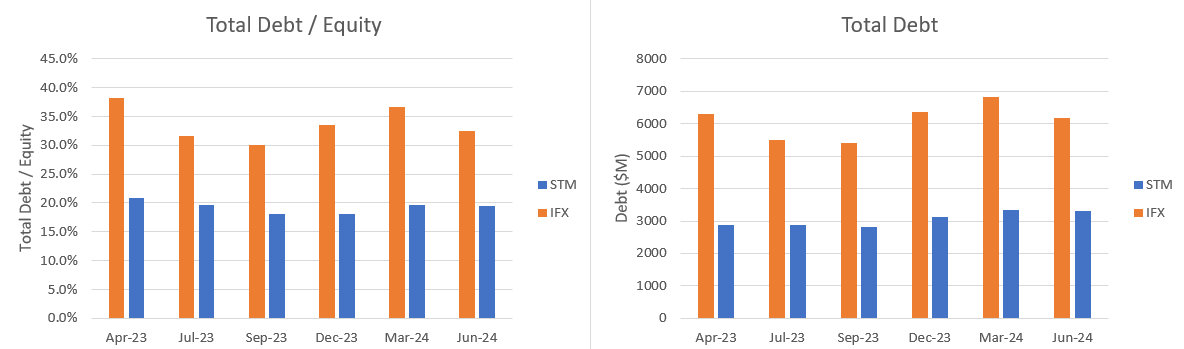
STM also has the better debt position, both in absolute terms and relative to the company’s common equity. However, despite this, and STM’s typically lower interest costs as an proportion of operating income (the inverse of Interest Cover), STM appears to have a considerably higher effective interest rate (Figure 12).

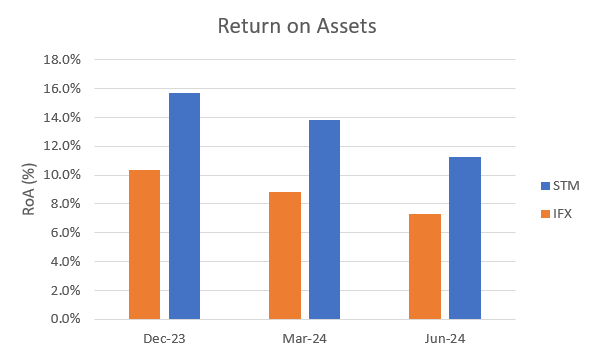
Yet, despite recent hardships, STM appears to be more effective at converting its assets into net income (Figure 13).
Valuations
When I valued STM in May, I ran valuation models using ‘bullish’ and ‘bearish’ scenarios. With my ‘bullish’ scenario, I assumed high earnings per share of $6 (matching 2023 performance) but with a large downside of between 20% and 77% (an average downside of around 50%), and free cash flow (FCF) of $1 - $2, but with ~ 15% FCF growth. I assumed price/earnings ratio would sit between 10 and 20. This scenario gave an estimated P20 value of $27 - $29. My ‘bearish’ scenario assumed $2 per share, with around 15% compounded annual growth, and other assumptions were as per my bullish scenario. This scenario gave an estimated P20 value of $27 - $32. In other words, I expected STM’s share price to sit close to $30 under both scenarios.
Given current performance, perhaps I wasn’t aggressive enough with my assumptions, but I am also trying to estimate the likely average performance over a 5 year period, not a quarter or single year. However, annualised earnings for STM based on recent performance would likely be between $1 and $2, with a roughly 65% - 70% reduction from the prior year. This is similar to the low EPS from my bearish scenario but the agggressive declines in earnings from my bullish scenario. Would this level of reduction be likely to continue for the next 5 years? FCF is closer to zero than I estimated, and is showing a decline over the last year, rather than a small increase as I had previously assumed would occur. Reductions seem to be stabilising, but a 15% growth may have been too optimistic.
If I adjust my assumptions to reflect more recent performance, and project that performance out for 5 years, I would be estimating the share price should be nearer $15 than $30. I couldn’t really justify a share price above $20 with this level of performance. But, equally, it wouldn’t take much growth to justify the current share price - a reverse DCF analysis suggests to me that 10% - 20% annualised growth from these low levels would be sufficient to justify the current share price. That level of growth would be similar to achieving an EPS of $3 - $4 in 5 years time, around only half of its 2023 results.
I haven’t previously valued IFX, and I don’t have the same level of my own in-depth research on this company as I have on my own holding, STM. However, if I take Finchat.io’s data at face value, in the last 5 years, IFX has seen EPS between $0.3 and $2.5 (when converted from Euros to USD), with an average of $1.24. Average growth over the last 5 full years has been 26%, trailing twelve months’ EPS performance has been -20%, and the annualised sequential performance over the last 4 quarters has been an EPS of $1.76 but with a growth rate of -52%.
Over the last 5 full financial years, Free Cash Flow has grown by an average compounded annual rate of 31% to just under $1 per share, however, its trailing twelve months’ FCF per share is nearer $0.48, so also around 52% lower than the values at the end of the last financial year.
If I build a valuation model with these assumptions, assuming a book value of between $5.50 (tangible value) and $14 (nominal value) and other assumptions similar to those used for STM, I estimate a P20 value of $10 - $13 (€11 - €14), with top-end values of $20 -$25 (€22 - €28). It’s worth highlighting that this valuation is allowing IFX to benefit from its 5 year average performance, i.e. I am being relatively generous with IFX compared to STM, and so by these estimates, IFX looks moderately expensive at $32 (€28) currently.

To justify the current price, my reverse DCF estimates that IFX would need EPS to grow by 10% on average for the next 5 years, or would need closer to 30% - 40% free cash flow growth, on average.
Increasing IFX’s P/E range to 10 - 15, which is closer to its recent history, increases the above valuations by a couple of euros and gets closer to the current value of €28 / $32, but in my opinion it doesn’t make a substantial difference, and there is very little between the two companies’ fundamentals to justify a difference in P/E multiple.
What do the companies say?
From the most recent quarterly earnings calls, STM did not see the growth in orders they expected in the second half of 2024, and revenue came in below their expectations in several markets. Microcontroller products and the Industrial applications saw the largest decline in the quarter compared to the prior year, with automotive applications declining by around 15%, driven by backlog reduction (is this a euphemism for order cancellations?) and reduction in their customers’ orders for electric vehicles as the EV market has softened. However, they declared “multiple” silicon carbide and Power & Discrete wins and announced a long-term silicon carbide supply agreement with Geely.
For next quarter, STM are guiding to a slight improvement compared to Q2 and for the full year, STM are anticipating revenue around $13.5bn, a 22% decline compared to 2023, and gross margins of around 40%. However, this also implies a stabilisation of current results, rather than further decline.
By contrast, IFX are expecting full year revenues of €15bn and adjusted gross margin in the low-forties. This implies ~8% reduction in total revenue compared to the prior fiscal year (IFX’s fiscal year is not aligned to calendar years).
IFX expect the market to be bottoming, which may be implicit in STM’s guidance, too. If so, perhaps STM’s stock price decline may be halted, and then the question becomes whether STM or IFX are better placed to profit from an upswing in demand and exposure to end markets.
Conclusions
I actually think STM looks like the company with better capital management, and with a higher likelihood of justifying its current price (slightly lower required growth rates from a DCF, and a price which is already within the realms of my valuations unless I use the most pessimistic assumptions).
However, I am perturbed by the abrupt drop in revenue, and how much more severe it has been for STM than for IFX. I like IFX’s segmentation, which helps understanding of risk exposure, and their specific auto exposure. The marked difference in revenue decline suggests STM is more exposed to Industrial end use applications and IFX has more automotive exposure. This is backed up by both companies’ analyst presentations, implying automotive markets make up 46% of STM’s revenue but over 50% of IFX’s revenue. IFX’s Q3 analyst presentation indicates that IFX have a larger market share than STM in most of the product and application categories highlighted. When I previously reviewed the analogue semiconductor industry in more general, I discussed how I wanted specific exposure to silicon carbide and gallium nitride for automotive market reasons, which both of these companies have.
Except for a price which looks slightly expensive to me, there is a lot to like about IFX. There is relatively little to choose between the operational performance of the companies, especially recently, and IFX definitely appears to be more stable than STM currently.
So I face a dilemma whether to stay with STM and trust in my analyses, have confidence in the long-term market trends and trust in STM’s historical operational advantage over IFX, or jump to IFX, trusting that IFX have a better grip on current market conditions and can continue to outperform STM.
A year or two ago, when first investing in STM, I chose STM over the competition for their operating margin benefits. I now need to ask myself whether that was a temporary situation, or whether I believe STM have a genuine fundamental operational advantage which they will likely regain. For me, despite my confidence being shaken, there isn’t a compelling reason (yet) to switch out STM for IFX.