


Industry Dive: Analogue Semiconductors
Is ST Microelectronics still looking good?

I first bought into ST Microelectronics ( STM 0.00%↑ ) in February 2023. At the time, I felt it was a good analogue semiconductor stock at a decent price with good upside potential, plus it was one of the few non-American stocks (allowing me some diversification), plus it gave me exposure to silicon carbide, which is expected to be important to the automotive industry in years to come, as the trend towards more electrification advances. But the last year hasn’t been as kind to STM as to some of the other stocks in its industry, so I wanted to undertake a more rigorous dive into the industry to decide if STM continues to show the promise I initially perceived. As a long-term investor, there would need to be a good reason for me to jump ship, so I’m hoping this research will just strengthen my resolve.
I have used ROIC.ai to extract the financial data used for this analysis, except for the 2022 Net Property, Plant and Equipment value for ON Semiconductor, which seemed to have an order-of-magnitude error, verified when I looked up that specific annual report.
Analogue Semiconductors
When we’re not discussing memory chips or the high-end microprocessors like the Central Processing Units (CPUs) or Graphics Processing Units (GPUs) developed by Intel, AMD, Nvidia, Qualcomm, Apple, Micron and the like, then we’re talking about the semiconductors and integrated circuits used in everything from calculators and digital displays, to temperature or pressure or motion sensors. Everything behind buttons, microswitches and application-specific integrated circuits (ASICs). This is a huge industry, typically with many thousands of specific products and hundreds of thousands of customers. For example, in their 2023 Annual Report, STM claim to work with 200,000 customers and thousands of partners. No single customer accounts for more than 10% of their accounts receivable.
Who are the major players?
There are a lot of companies in this industry - the NAICS Association tells me there are 4,435 companies registered in the US under SIC code 3674 (Semiconductors and Related Devices). Precedence Research believes that the global semiconductor industry was worth $545 billion in 2023 and will have a Compounded Annual Growth Rate (CAGR) of over 7% for the next decade.
I am going to compare 9 companies herein, which collectively accounted for around $130 billion in 2023, i.e. a little under a quarter of the total industry. These companies are:
ST Microelectronics ( STM 0.00%↑ )
Analog Devices ( ADI 0.00%↑ )
Texas Instruments ( TXN 0.00%↑ )
NXP Semiconductors ( NXPI 0.00%↑ )
Infineon Technologies AG ( €IFX, listed in Germany )
Microchip Technology Incorporated ( MCHP 0.00%↑ )
Broadcom ( AVGO 0.00%↑ )
ON Semiconductor ( ON 0.00%↑ )
ROHM Semiconductor (listed on the Japanese exchange, $ROHCY on the US markets)
Silicon Carbide (SiC)
Silicon carbide is a high-performance semiconducting compound. According to ROHM semiconductor, it has 10 times the electrical field breakdown strength and 3 times the band gap, which allows the semiconductor to continue operating at higher temperatures than a typical silicon semiconductor. With higher transistor switching speeds, it is a more efficient technology than silicon and is expected (along with gallium nitride, GaN) to take an increasing share of the power electronics market for electric vehicles, where efficiency is key. However, it is harder to manufacture and inspect for quality defects.
Evertiq considers that 5 firms control the SiC market, with a share of over 90% between them. ST Microelectronics has the highest market share, at 36%, followed by Infineon at 18%. The other key players are Wolfspeed, ON Semi and ROHM. I have not included Wolfspeed in my analyses because, as it has been running an operating loss and net income loss since every year since 2015, it is not a company I consider investable currently.
The Income Statement
There has been one absolute stand-out stock over the last decade in terms of revenue growth, and that is Broadcom ( AVGO 0.00%↑ ). Especially in the years 2014 - 2017, its growth compared to other companies in the industry was absolutely stellar.
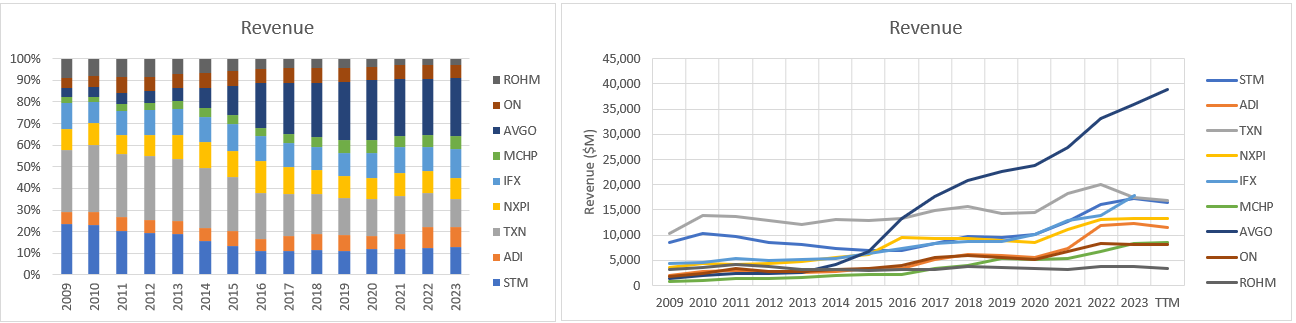
Looking at this as a year-on-year revenue gain and as a Compounded Annual Growth Rate (CAGR) over 5 years, it can be seen that there is a high degree of variability across companies (0% to 20% CAGR), and that 2023 has generally been slow compared to 2022. Apart from Broadcom, Infineon, Microchip and ADI have been showing the best long-term growth rates recently, with ST Microelectronics now achieving a similar 5-year CAGR as Broadcom.

The semiconductor industry is a high-margin industry. Again, Broadcom is smashing it, having increased gross margins from less than 40% 15 years ago, to almost 70% in 2023. Microchip is also achieving very high gross margins, as is Texas Instruments and Analog Devices. The SiC producers (STM, ON, ROHM and IFX) are relatively clustered together at around 40% gross margin, although ROHM appears to have been falling behind since around 2020.

Generally, the net profit margins are in the 20% - 30% range, with Broadcom and Texas Instruments at the top. TXN has been consistently achieving high margins for some time.
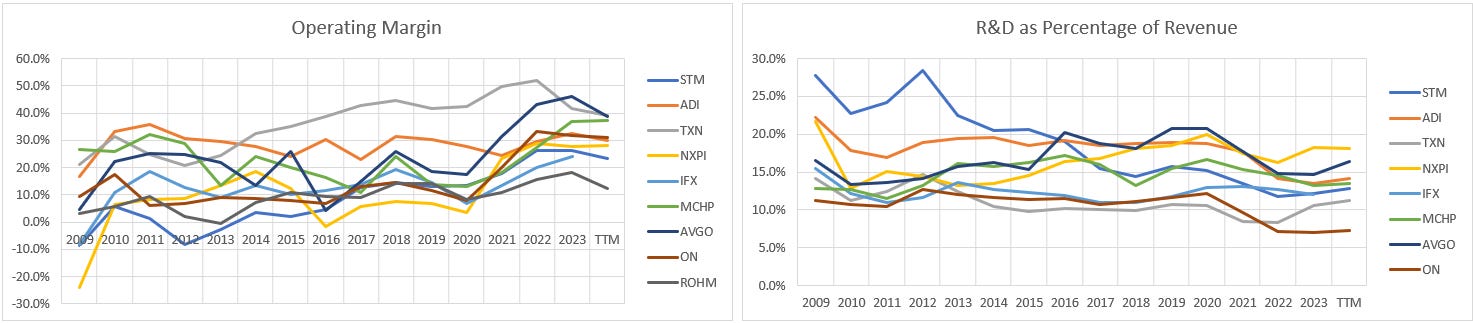
There is clearly a substantial difference between the gross and net profit margins, which is largely because the industry expends a lot of resource on Research and Development expenses, often between 10% and 20% of sales. Looking at the Operating Margin of these companies, AVGO and TXN again look quite impressive, with TXN having consistently achieved high operating margins for a prolonged period of time, although AVGO’s recent margins look particularly impressive in light of its elevated R&D expenditure. ON Semi has recently allowed its R&D expenses to drop quite a bit, while STM have brought their R&D expenses into line with the industry (vs. having the highest proportional spend on R&D before 2016).
N.B. ROIC.ai doesn’t give me insight into ROHM’s R&D expenses, so they are missing from this graph.
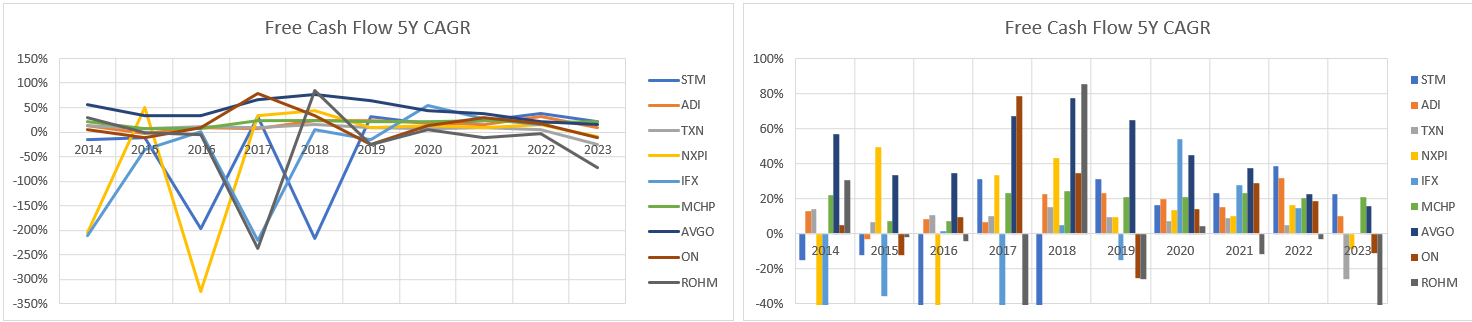
Looking at how this translates to earnings growth (graph capped at -40% to avoid obscuring the more recent trends), AVGO’s performance, even with the smoothing of 5 years, is highly volatile. Infineon’s growth rate has generally been accelerating, while STM’s earnings growth has been slowing. Microchip has also been showing very decent growth rates over the last 5 - 6 years.

Capital Investment
The semiconductor industry is very capital-intensive, with capital expenditure (CapEx) consuming a large proportion of earnings. The industry has also been going through an investment cycle since around 2020, with a number of players now investing more than 25% of revenues and 3x to 4x the cost of depreciation and amortisation of existing assets. STM and TXN appear to be the most aggressive investors.
However, now Microchip and AVGO are at the bottom of the list and appear to be investing far less than their depreciation expenses.

Looking at how the Property, Plant and Equipment (PPE) is converted into revenue of earnings, it can be seen that AVGO earns $15 - $16 of revenue for each $1 of net PPE on the balance sheet, with Microchip a distant second at around $7 of revenue per $1 of PPE. As with gross margins, the SiC producers have the lowest number of turns (the number of times the value of PPE held on the balance sheet is converted into revenue in a year), with Infineon the best at 2.4 turns. TXN has also dropped to near the bottom since it has increased its capital expenditures from 2022. But when we then look at the Return on Assets (how all of a company’s assets are converted into net income), TXN is now the best-performing company, with STM, ON and NXPI achieving similar performance. It’s worth pointing out that returns on assets of 14% - 16%, as seen in this industry, is generally quite impressive.

Considering the level of CapEx, the Free Cash Flow (FCF, calculated simply as cash flow from operations, less net capital expenditures on tangible and intangible assets) is generally not actually that high and FCF growth is pretty spotty. Generally, the FCF 5Y CAGR has been dropping across the industry, although there are differences between companies. Cash conversion ratio (FCF relative to earnings) is highly volatile, but quite a few companies have conversion ratios far below 1, showing just how much of the operating cash flow is being re-invested in capital assets.

Debt and Cash Management
Investing over one quarter of sales in CapEx is significant money - how is the debt position of these companies? Below I have shown Debt / Shareholder Equity, and Net Debt / Shareholder Equity. They are shown on the same scale to show the significance of the net debt position for several of these companies. I have cut the graph at 200% debt/equity, meaning the true level of NXP’s debt, relative to company equity, before 2015 is obscured, but as their debt is now more in control, I don’t see that as crucially important. What is important to highlight is that the primary driver for NXPI’s high debt/equity ratios before 2015 was not the level of debt per se, but the low level of shareholder equity. 2015 is when NXP merged with Freescale Semiconductor, and there is a significant change in their balance sheet following that event.
It is clear from Figure 9 that a number of companies are running quite high levels of debt, relative to shareholder equity, in particular, Broadcom, NXP, Microchip and Texas Instruments. And on a net debt basis, i.e. total debt less cash & equivalents, Broadcom, NXP and Microchip remain quite highly indebted. But Texas Instruments is now similar to the other companies, meaning a reasonable amount of that debt is sitting as cash on the TXN balance sheet. There are also a number of companies who have been running a negative net debt position in recent times, including STM. Despite the high relative debt, all companies are currently running effective interest rates of less than 5% (calculated from ROIC.ai’s interest expense data, not shown)

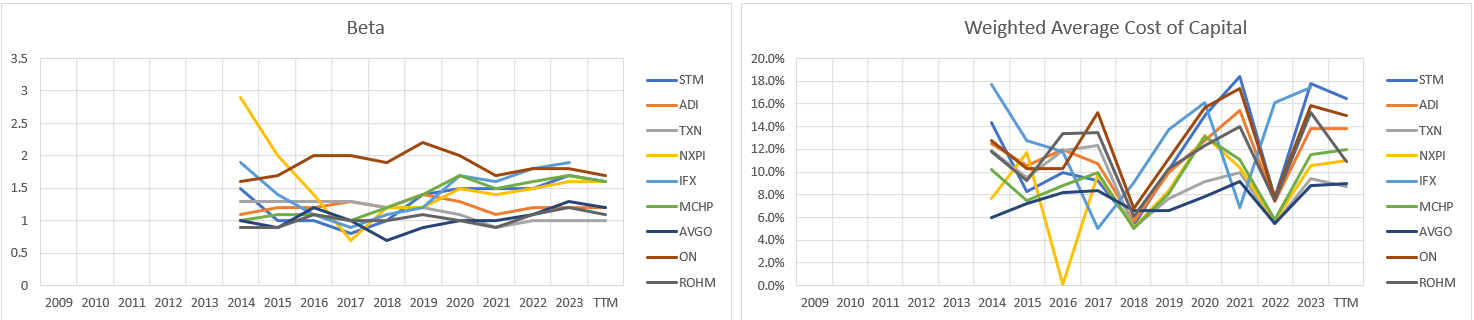
So what does this mean for cost of capital and returns on capital? I have calculated Weighted Average Cost of Capital (WACC) from the companies’ beta values, effective tax rates, levels of debt and levels of equity, using the S&P 500 index and US 5Y treasury yields as my references. I used Zack’s research platform to find beta values for each of the stocks, but I could only go back 10 years, meaning I can only calculate WACC from 2014 to present.
Beta for many of the stocks is around 1.5 - 2, meaning they are likely to be more volatile than the general market, but TXN, ROHM, ADI and AVGO are all closer to 1. This plays into AVGO and TXN having quite moderate WACC, at around 9%. At the other end of the scale, STM, with their low debt and relatively high beta, is seeing WACC of over 16%, similarly for Infineon.
High WACC leads, in my Discounted Cash Flow models, to a depressed present value, so I would expect STM and IFX to need a lower share price today than TXN or AVGO to compensate for this high cost of capital.
Turning to returns on capital, I have calculated Returns on Capital Employed (ROCE) and Returns on Invested Capital (ROIC) for these companies, using data from ROIC.ai. ROIC.ai does not break out deferred tax assets, meaning the ROIC data may not completely align with a more rigorous analysis directly from the companies’ financial statements.

In short, TXN have been leading the industry for a long time, but are now falling back into the crowd. The industry as a whole has taken a hit in 2023 and on a Trailing Twelve Month (TTM) basis, but generally speaking many companies are still achieving 20%+ returns on capital by either measure. So they are able to compensate for the high cost of capital in most cases.
As cash management is key to a number of the above performance metrics, a brief review of Quick Ratio and Current Ratio reveal that most of these companies are sitting on relatively large cash balances and current assets, relative to their current liabilities. Microchip, ADI and Infineon are moderately low on cash, and Microchip are also running their current assets close to their liabilities. AVGO and ROHM have recently allowed their cash to dip, but historically have kept a significant amount of cash available. STM are maintaining a comfortable cash balance, relative to their liabilities.

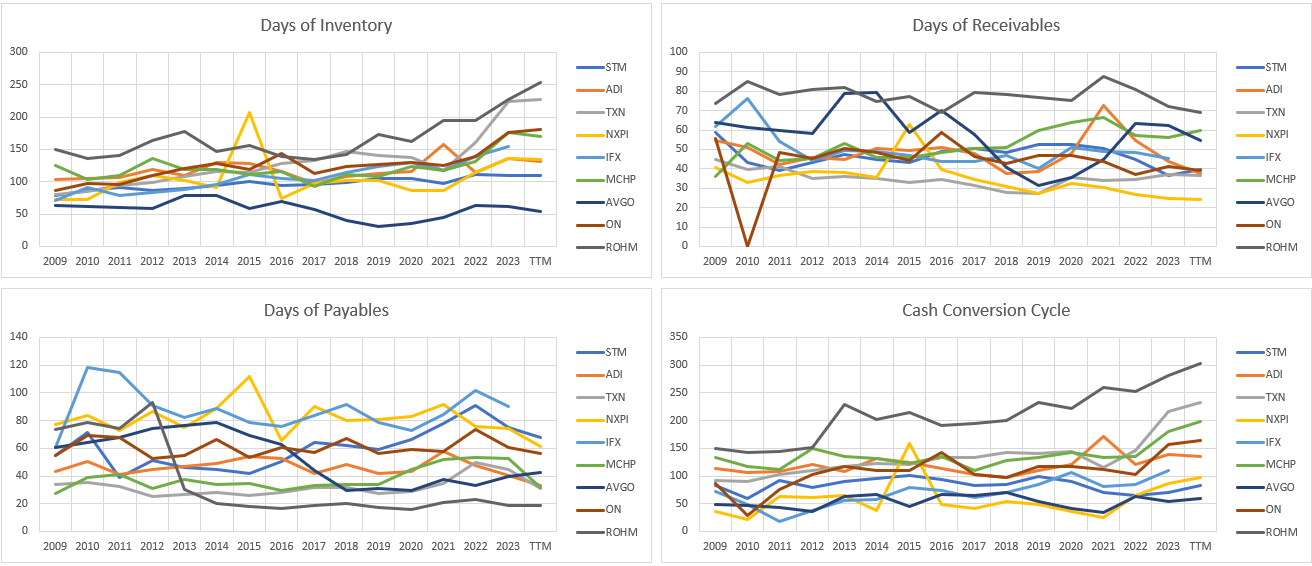
Inventory Management and Cash Conversion Cycle
One of the elements I have been keeping an eye on as an STM shareholder has been inventory management. In their 2024 Q1 earnings call, they have highlighted their unused capacity charges, which have been increasing every quarter for the last year.
However, when we look across the industry, we see that STM is actually showing pretty good inventory management and has one of the shortest cash conversion cycles, even if it has been creeping up of late. Only Broadcom is consistently better. ROHM and Texas Instruments definitely have more work to do to get control of their inventories.
Conclusions
The main conclusion I have drawn is that there is no single obvious best company. Several companies each have particular strengths and weaknesses, which is perhaps no great surprise, and therefore different investors will probably value these companies differently.
I have tried to compress the above discussion into the below ranking table, where #1 is best and #9 is worst, focussing primarily on the most recent results. This clearly hides a lot of detail, such as recent changes in trends, which affects ROHM and Texas Instruments, or where there is actually very little difference in results between companies, but one is marginally better than another.
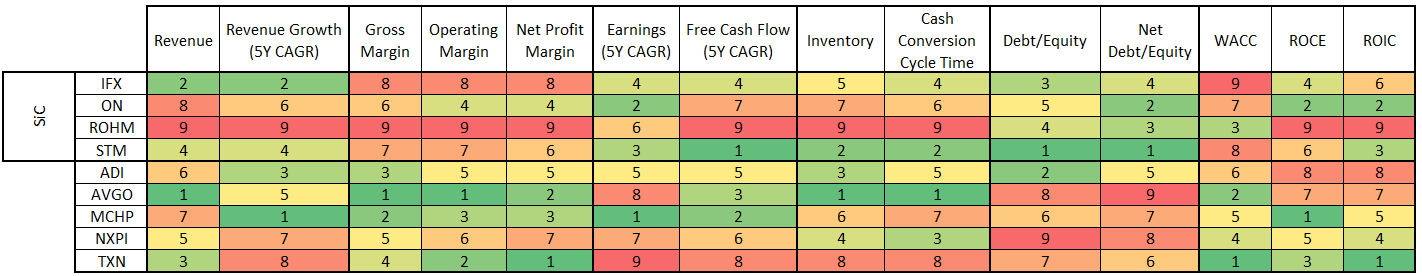
Overall, I remain happy with my investment in STM 0.00%↑ . I believe STM show a good balance of market share and growth potential with good business management. Texas Instruments and AVGO look interesting for non-SiC markets, and both ON semiconductor and Infineon look promising in the SiC segment. Infineon, in particular, appears to have the best momentum behind it, and I will review this position when Infineon’s full year results become available in September.