


Investing Strategy: Working Capital
How much attention do you pay to a business' working capital requirements?

Working Capital and the Cash Conversion Cycle
A business makes money by utilising its assets to generate revenue which results in a profit. There is usually a time lag between the company reaching agreements with suppliers to provide raw materials, processing those materials into products to sell, agreeing a sale with consumers, paying for its raw materials and receiving payment for the final goods. The period of time between cash leaving the business to buy material for inventory, and cash being returned to the business as customers settle their invoices is the Cash Conversion Cycle. It indicates the amount of liquidity a business needs to have to maintain its operations.
Working Capital
Working capital is the amount of capital (cash equivalent value) required to conduct basic business operations throughout the year. At its simplest, the working capital is the difference between a company’s current assets and its current liabilities. In general, working capital is not available for investment by the business to create additional revenue, as it represents money which either has not yet been received or which will soon be leaving the company to pay its bills. Although there are other elements, such as cash and equivalents, typically a lot of the working capital is made up of:
receivables - money which is due to the company from its customers. This could be for goods already received but not yet paid for, goods for which a sale has been agreed but goods have not yet been delivered (for example, when you buy a new fridge freezer or new oven for delivery in a few weeks, or your new made-to-order car for delivery in a few months), or deferred revenues e.g. a previously-agreed multi-year contract for IT equipment or software or support.
inventory - materials held by the company for the purpose of turning into product, material in the process of being turned into final product (work in progress) and finished goods awaiting sale (but for which no sale has yet been agreed).
payables - money the company is due to pay to its suppliers (or to the government in taxes) in the next year, typically to pay for raw materials or to pay its employees for their labour. With accrual accounting, which is the typical accounting method used by most companies, this category may also include the formal accounting of pre-paid expenses, for example, if the company has previously purchased multi-year services, paid in advance.
Accrual accounting leads to differences between the income statement, which represents the formal recognition of contractual obligations, and the statement of cash flows, which records the actual value of money entering and leaving a business.
The Cash Conversion Cycle
Payables and inventory represent cash which has already been formally spent by the business and expensed to the income statement (also known as the Profit & Loss statement, or P&L statement). Receivables represent cash which has been formally recognised as due to the business, but hasn’t yet been received.
Generally, the size of each of these categories adapts with the revenue of a business - more sales tend to lead to more customers owing money at any point (or larger orders causing more money to be owed), increased inventory to provide more stock for sale, and increased material costs to enable more products to be manufactured. However, it is often insightful to compare the relative change in each of these categories over time with the growth in sales. The value held in each of these categories can be represented as equivalent days, based on sales made or cost of goods sold (COGS) incurred in a year.
Days’ Receivables Outstanding (DRO) = Trade Receivables / Revenue * 365
Days’ Payable Outstanding (DPO) = Trade Payables / COGS * 365
Days’ Inventory Outstanding (DIO) = Value of Inventory / COGS * 365
Where the information is available, often disclosed in annual reports but not always in quarterly or semi-annual filings, I separate ‘trade’ payables and receivables from other sources, as it is exclusively the costs associated with the business’ operations which interest me.
A company uses its cash reserves to buy materials that become work in progress and then become finished goods, stored as inventory, over a period of time. The company is invoiced for those materials and, some time after receipt of the materials, it uses cash to pay its suppliers. Those finished goods from inventory are then ultimately sold, customers are invoiced, and some time later they pay the company, returning cash to the business. The period of time for which that cash is unavailable to the business is the cash conversion cycle. A shorter time period is better for the business, as it implies less of the company’s capital that is unavailable at any point, leaving more of the company’s capital available for reinvestment and profit creation.
The formula for Cash Conversion Cycle (CCC) is:
CCC = DIO + DRO - DPO
(N.B. I have just noticed that in the last few days, Brian Feroldi has also written a note on the cash conversion cycle (link here). Brian calculates receivables from credit sales, which is ideal if the information is available.)
One interpretation of the cash conversion cycle is to indicate what proportion of the money being provided to the business each year is unavailable for use at any point.
If the cash conversion cycle is increasing, it indicates a company is either struggling to collect the money owed to it, is creating more inventory than it can easily sell, or is having less credit extended to it by its suppliers i.e. is being asked to pay its suppliers more quickly. None of these are good omens for a business. So, often, trends in working capital are more valuable than the absolute value of working capital itself (although it can be insightful to compare the cash conversion cycle of various companies in the same industry if you can be confident the raw data being used by the calculations is comparable).
When discussing trends, particularly in inventory, a brief reflection on the current time period is worthwhile. The disruptions Covid caused to consumer demand in 2020 through 2022 and the subsequent supply chain disruptions have caused distortions in the levels of inventory held over the last few years, relative to historic norms. Therefore, it is probably instructive to review recent trends over a longer time frame and compare recent cash conversion cycles to pre-Covid periods, rather than the most recent 1 - 3 years.
Is Inventory an Asset or a Liability?
How do you determine the value of inventory? Is it the cost of materials at time of purchase, or the value the raw materials could be sold for today? Does work-in-progress have any tangible value? It is not in the form of raw materials, immediately convertible into other products, or finished goods, which offer immediate value to a customer. Are finished goods held in inventory worth today’s sales price, or a lesser price if they would have to be heavily discounted to sell them and convert to cash?
In “The Goal”, by Eliyahu Goldratt, the protagonist learns to appreciate inventory as a liability - a relatively illiquid set of assets preventing cash from being used by the business for growth or profit, and often impairing the operational efficiency of a business, for example though increasing logistics and warehousing expenses and management, ageing inventory losing value or wastage from a finite shelf life, etc.
When I am calculating a company’s book value, or equity per share, I will discount the value of work in progress and finished goods inventory, as there is no guarantee that the full value of these assets can actually be realised.
I also try to calculate Cost of Goods Sold (COGS) as more directly related to material costs by excluding the fixed costs of depreciation, amortisation and employee costs where the information is available to do so. By excluding non-cash and fixed expenses, I believe these adjustments offer a truer picture of the equivalent days’ of production held as inventory than the expensed COGS value reported in the P&L statement.
I recognise that employee costs can be argued to scale with COGS and with revenue, but I do not believe that companies scale their employee count up or down as quickly as they adjust their material purchases to reflect changes in customer order bank, so I prefer to exclude employee costs from my COGS and inventory calculations.
Cash Conversion Cycle for my Portfolio
For expediency (I have not updated my research to be on the same timeframe for all of my stock holdings), I am using the most recent data from my analyses for a number of my stocks. I have not calculated these parameters for all of my stock holdings currently, particularly my smallest holdings or positions I have opened most recently, as I have not reviewed recent financial reports in enough detail yet. Because we are currently in the middle of earnings season, and a number of my stocks do not give me the necessary insights for my calculations until annual reports are published, a number of the results below refer to the previous year’s financial reports. However, typically, the working capital requirements do not change substantially year to year (unless something has drastically changed with respect to the company’s circumstances, which by itself would be grounds for further investigation). Please also note - on occasion, I have applied my own interpretation of the values reported in the Notes to the Accounts to determine ‘trade’ vs. ‘other’ payables or receivables.
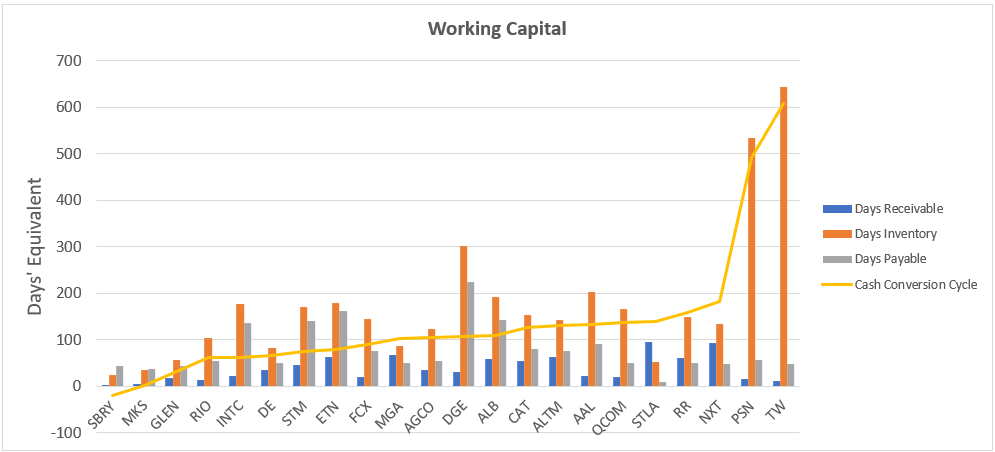
A quick review of Figure 1 shows that I hold stocks with a wide range of cash conversion cycles. In the case of Sainsbury’s (SBRY), cash conversion cycle is actually negative, meaning Sainsbury’s receives money from its customers before it is due to pay its suppliers. This is explained more fully in my Sainsbury’s Deep Dive. At the other end of the spectrum, the housebuilders, Persimmon (PSN) and Taylor Wimpey (TW), take almost 1.5 years to bring money back into the business after having initially spent it, predominantly because of the amount of inventory held. This will be no surprise to many people, given the average house cost, but it shows that housebuilders need to commit a lot of capital - more than a full year of revenue - to maintain their business operations at any point in time.
Over one third of my holdings analysed above have a cash conversion cycle of less than 90 days, almost one quarter have a cash conversion cycle between 90 days and 120 days, a further 30% have a cash conversion cycle between 120 days and one year, and around 10% have a cash conversion cycle in excess of one year.
A notable element of Figure 1 is the high level of inventory held by Diageo, which is dominated by maturing spirits. In contrast to my arguments above, this is one example where, perhaps, the value of “work in progress” could be fully realised if ever the inventory needed to be liquidated. A secondary note here is that, for the same reason, Diageo has a significant amount of long-term inventory, which I have excluded from Working Capital (as it is not required to support the coming year’s operations).
Other salient points are the difference in cash conversion cycle by notionally similar stocks, like M&S (MKS) and NEXT (NXT) - NEXT holds more inventory and takes longer to recover money from customers, but this may be related to the presence of higher-value items in NEXT’s catalogue, like home furniture. Intel and ST Microelectronics have similar levels of inventory to Qualcomm, but have much shorter cash conversion cycles because they also we more money to suppliers via payables than Qualcomm. This means Qualcomm is less able to retain cash within the business at any time than Intel or STM. Also, Stellantis (STLA) has relatively low inventory, with their cash conversion cycle being dominated by payables, which is unusual compared to my other stocks.
Inventory Breakdown
Most financial reports also enable interrogation of how the inventory is broken down into different categories. Often, these categories are raw materials, work in progress (WIP) and finished goods. Occasionally, there may be a company- or industry-specific additional inventory category (such as seen with Deere, who apply a first-in-first-out to last-in-first-out inventory value adjustment, which appears as a negative value of inventory).
I find it insightful to review the inventory breakdown, as large amounts of finished goods may indicate difficulty with converting product into revenue and possibly indicate over-production, whereas a large amount of WIP may indicate production inefficiency and an inability to turn raw materials into finished goods. High levels of raw materials, even though it represents company capital which is less liquid than cash, may imply intentional hedging strategies and is also more likely (in my opinion) to be able to be liquidated at fair value (as there will be more people interested in using the raw materials for any number of purposes than would be interested in the specific product of a given company).
I need to make a caveat with my analysis apparent here - because different stocks provide different levels of insight into inventory holdings between quarterly and annual reports, I have tried to use the most recent inventory breakdowns I have analysed. This exposes my analysis to a risk that, by using inventory and trade payables / receivables results from one set of reports but inventory breakdown from another report, my calculations for absolute days of inventory calculations are not coherent with the days of payables and receivables and cash conversion cycles calculated above. However, I don’t expect that the relative proportions of inventory held as finished goods, WIP or raw materials will vary much within a year, so I expect that the conclusions drawn below will remain valid at the end of the financial year.
A (further) specific caveat to the foregoing discussion is worth noting with commodities, such as my mining stocks, where the value of finished goods may change with the prevailing price of the commodity and the influence of futures contracts. This could be the case with my ALB numbers, which date from the middle of 2023, at the end of the large run-up in lithium prices seen during 2022. At the time, ALB was typically contracting 6 - 9 months ahead of production, meaning their inventory held a high contractual value, as much of that production would have been bought in 2022, even though the prevailing price of lithium was dropping by the middle of 2023.
Reviewing the inventory breakdown for the majority of my portfolio, shown in Figure 2, it is clear that my retail industry stocks (SBRY, MKS, NXT) tend to only hold finished goods, and a relatively small number of my stocks hold high levels of WIP or finished goods - my semiconductor stocks (INTC, STM and QCOM), Diageo (DGE) and maybe Rolls Royce (RR) being the holdings most exposed in this fashion. The relatively good news, in my view, is that the stocks with the highest inventory levels, my housebuilders, are holding the majority of their inventory in raw materials (including land), which I have higher confidence can be liquidated at fair value if required. For this reason, I am not too worried about the higher inventory being held by TW vs. PSN - the vast majority of the difference is held as raw materials. Although land is not very liquid or quick to sell, I am quite confident that the value of the land will be quite resilient.

The Bottom Line
All companies require capital to fund their ongoing operations. By reviewing the working capital, an investor can understand how a company is using cash to maintain its operations and whether a company is finding it harder or easier to release funds for other purposes over time. The investor can also draw some inferences as to the challenges being faced by the business from an understanding of changes in payables, inventory and receivables over time, and get some further insight into how a company compares to its competitors.
To me, an assessment of working capital is an important part of developing a thesis before I buy a stock, or when reviewing my existing holdings.
How much attention do you pay to working capital with your investing strategy?