


Deep Dive: Eaton Corporation (NYSE:ETN)
Digging into one of my core holdings

Eaton Corporation (ETN 0.00%↑ ) are one of my main holdings. At the time of writing, Eaton are my 3rd-largest individual holding, accounting for almost 9% of my individual stocks portfolio.
So who is this company, and why do I have so much conviction in them?
What is Eaton’s Business?
My interest in Eaton originally came from my day job as an engineer in the automotive industry - I was aware of Eaton as the manufacturer of superchargers and a number of drivetrain- and valvetrain-related components. But when I looked into them, I realised this was actually only a small element of their business.
For the most part, Eaton make a range of electrical equipment for a large number of end markets. They service: automotive and aerospace industries, including specifically e-Mobility for electric vehicles (EVs); commercial, industrial and residential buildings (including multiple-occupancy buildings); data centres; and utility sectors. As well as the automotive components mentioned, at a high level, they make actuators, components for conduit and cable management, power supplies, racks and thermal management solutions for data centres, controls, relays, contactors, fuses and other switchgear and protection equipment for low and medium voltage grid solutions and high-voltage electric vehicle solutions. Basically, their product portfolio is VAST.
There are other companies who produce similar equipment, but each company has its own niche, as you might expect. Other companies who have some level of overlap with Eaton’s products include:
Ametek ( AME 0.00%↑ ) - segments include automation, aerospace and power, and process and analytical instrumentation, split by industrial and medical sectors
Vertiv ( VRT 0.00%↑ ) - Vertiv has a focus on products for data centres, having previously reported critical infrastructure and integrated rack solutions separately.
Emerson Electric ( EMR 0.00%↑ ) - split into Intelligent Devices and Software and Control business groups, Emerson reports across seven segments including control, measurement & analytical, safety, discrete automation, and optimisation software (AspenTech)
Schneider Electric ( $EPA:SU ) - Schneider divides its business into four end-markets: buildings; data centres and networks; infrastructure; infrastructure; and industry. The company splits revenue out as products, systems, and software & services.
Siemens Energy ( $ETR:ENR ) - Siemens Energy reports as Gas Services, Grid Technologies, Transformation of Industries, and Siemens Gamesa (its wind energy arm, having acquired it to shore up its perilous financial position in 2023).
ABB Ltd ( $STO:ABB ) - having recently undertaken some significant restructuring and divested or spun out non-core businesses such as its turbocharger business, Accelleron, ABB now reports under Electrification, Motion, Process Automation, and Robotics & Discrete Automation segments
Looking at the stock price performance for each of these stocks over the last 5 years, and comparing them all to the S&P 500 Industrials segment, Eaton has been one of the highest performers and has consistently beaten the S&P500 Industrials index. Of the selected competitors, only Vertiv, with its heavy exposure to data centres, has beaten Eaton, and that outperformance has really only occurred over the last 18 months. Vertiv’s stock is also demonstrably more volatile, as Vertiv underperformed the index between 2022 and 2023. Vertiv’s recent outperformance should not be underestimated but, as a long-term investor in Eaton, I see a lot to be happy about.

Assessing revenue and statutory earnings per share (EPS), as shown below, Eaton is the stock with the strongest and most consistent earnings growth over the last 5 years, having achieved a compounded annual growth rate (CAGR) of over 12%. Although the absolute earnings per share cannot be compared between stocks, as it is a function of absolute net income and the number of shares outstanding (diluted) for each stock, trends can be compared, as can whether or not a company has been consistently profitable. Eaton is not the highest revenue company of those compared, nor is it consistently the highest-earning, but it is both large and consistently profitable.
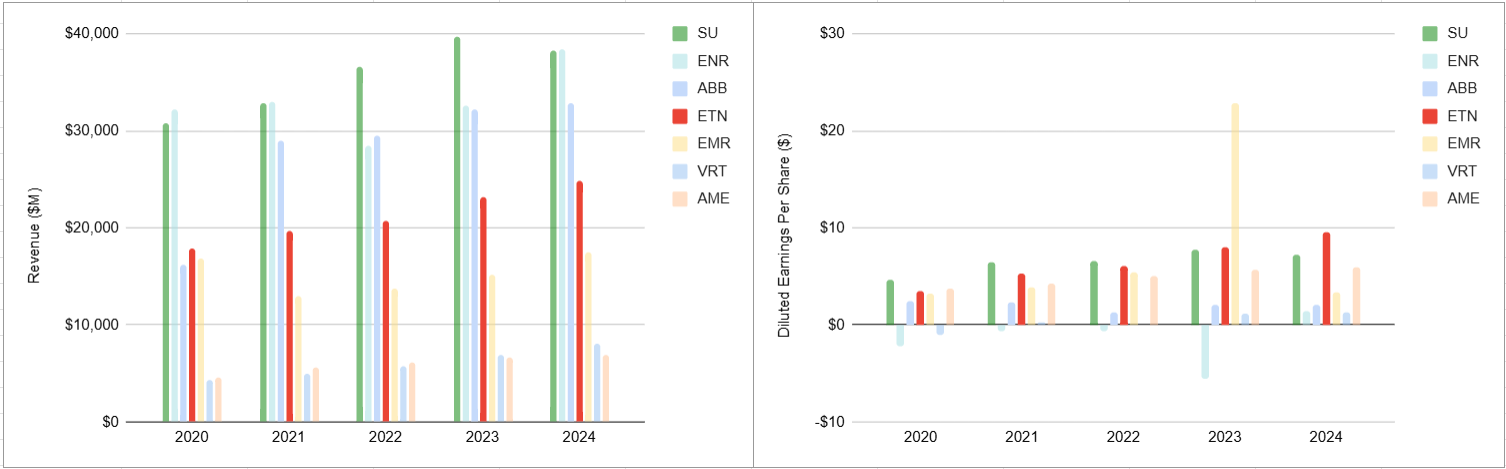
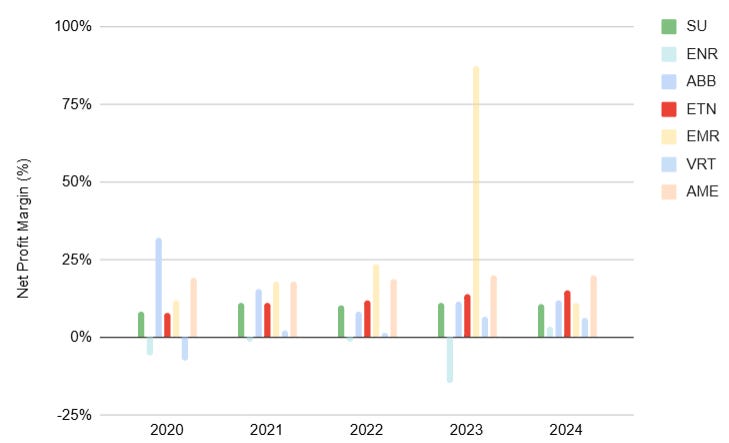
As indicated by the EPS data above, Emerson had a huge boost to earnings in 2023 due to the divestiture of its Climate Technologies business, named Copeland, as well as the divestiture of two smaller businesses, InkSinkErator and Thermo-O-Disc. Collectively, these businesses added almost $11 bn to Emerson’s after-tax profits in 2023, worth around $18.95 per diluted share outstanding. Excluding this income, diluted EPS for Emerson would have been around $3.95, and net profit margin would have been 15%, instead of the 87% reported. In 2023, Emerson acquired National Instruments (NI). In 2022 (the last full year for NI financial statements), NI recorded sales of $1.65 bn and net income of nearly $140M. This means, based on 2024 Emerson results, NI likely accounts for a little under 10% of Emerson net sales and around 7% of Emerson net income.
Net profit margins of 15% would put Emerson on similar net profit margin to Eaton, although Eaton’s profit margin has been growing, while Emerson’s has been shrinking. In fact, only Ametek has consistently achieved higher net profit margins than Eaton, although it is a much smaller company (with a market capitalisation of ~ $42 bn, vs. Eaton’s market cap of $118 bn, at the time of writing).
Schneider Electric were the other company showing consistently strong earnings and earnings growth, but their margins have been fairly flat and lower than Eaton’s margins in recent years.
Overall, this means that I am happy that Eaton is a consistently profitable company in this industry, with good (and increasing) profit margins, and a good history of share capital growth in the recent past.
Eaton Segments - Revenue and Profit
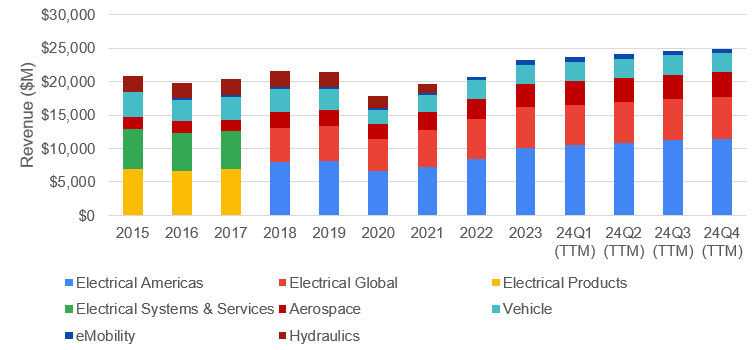
Over the last ten years, Eaton has adjusted its segments a few times, introducing eMobility in 2018, resetting its Electrical segments in 2020 (from ‘Electrical Products’ and ‘Electrical Systems and Services’ to ‘Electrical Americas’ and ‘Electrical Global’), and the removal of the Hydraulics segment following the sale of the business to Danfoss in 2021.
For the interested reader, Eaton’s financial reports do still break down the electrical segments into ‘products’ and ‘systems’, and also give a breakdown within aerospace and vehicle sectors. However, I have elected not to go into that level of detail in this write-up. At a very high level, the majority of the revenue in Electrical Americas comes from ‘systems’, Electrical Global has a slight bias towards ‘products’, Aerospace is split between Original Equipment Manufacturers (OEM), Aftermarket and Industrial and other segments, with OEM taking about 20% more revenue than aftermarket or Industrial and other segments, and about 60% of the Vehicle segment comes from commercial vehicles, with the remainder coming from passenger and light-duty vehicles.
Over the period from 2015 to 2024, the aerospace segment revenues have grown at a compounded annual growth rate (CAGR) of over 8%. Since the introduction of the specific segment, Electrical Americas revenue has grown at a CAGR of over 6%, while Electrical Global revenue has grown at roughly half that rate. Since 2015, the combined electrical segments’ revenue has grown at a CAGR of 3.6%. eMobility as a segment has been growing strongly, at 12% CAGR, albeit from a low base. The Hydraulics business revenue had been declining at 10% per year on average from 2015 until its sale in 2021, while the Vehicle segment has been declining at a rate of 3% per year. Overall, Eaton revenue has been growing at 2% per year since 2015, although recent growth has been far stronger. Covid hit the company hard, with an almost 17% drop in revenue in 2020 compared to the prior year, and it took 3 years for revenue to surpass its pre-Covid level. However, since then, growth has been strong, with 2024 revenues up 7% on 2023 levels, and revenue growth achieving over 8% CAGR since the lows of 2020.
Looking at where Eaton generates revenue, it is focussed on the Americas, with over half of its revenue coming from the United States, and around two thirds or more coming from the United States, Canada and Latin America combined. Around 20% comes from Europe, with only around 10% coming from the Asia Pacific region. Between 2015 and 2023 (2024 figures not yet available), the United States has been growing at between 2% and 3% per year, on average, while other regions have been broadly flat or in slight decline. Revenue from Latin America has declined the most, with a CAGR of -1.3% over the period since 2015.

Despite the low revenue growth, Eaton has been doing quite a good job at growing profits. Using the segment operating profit data from Eaton’s financial reports, overall operating profit margin has increased from around 15% in 2015, to 24% in 2024. Operating profit, in dollars, has grown at a CAGR of 7.4% over that period. Although profitable, the hydraulics business was a drag on overall profit margin, with below-average margins. Aerospace profit margins have expanded from 17% in 2015 to around 23% in 2024, but has been overtaken recently by profits margins in the Electrical Americas segment. Electrical Americas is now producing profit margins in excess of 30% and accounts for over half of all segment operating profit, leaving Electrical Global very much in its wake, at around 19% of total segment operating profit and with a profit margin of only 18%. Overall, electrical segments have increased from 62% of the total segment operating profit in 2015, to over 77% in 2024. Although the eMobility segment is loss-making currently, it is only consuming 0.1% of Eaton’s operating profit, therefore it is not material to the overall profit margin Eaton is achieving.
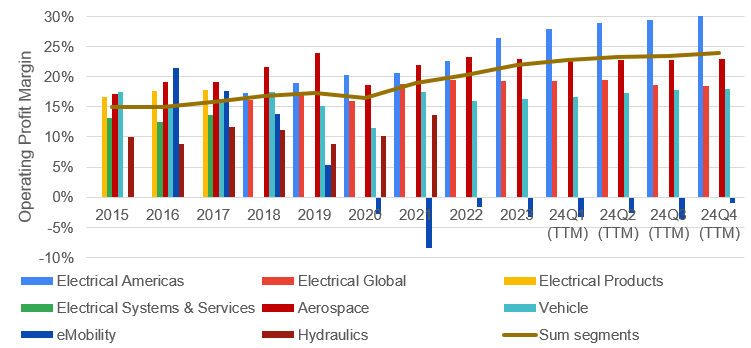
So, in aggregate, Eaton has been growing revenue at around 2% per year, but growing operating profit at over 7% per year, with growth concentrated in the United States.
Consolidated Income and Profit Margins
Eaton is a company in control of its expenses. It has consistently kept Research & Development (R&D) expenses to around 3% of revenue, and Selling, General & Administrative (SG&A) expenses to around 16% of revenue, down from 17% of revenue in 2015. Gross margin has increased from 31% to 38%, and adjusted operating profit margin has increased from 11% to almost 19%. I have adjusted operating profit to exclude the exceptional items of selling their automated transmission business to Cummins in 2017 for over $1 bn, or an historic arbitration cost of $275M in 2018 against subsidiary Cooper Industries.
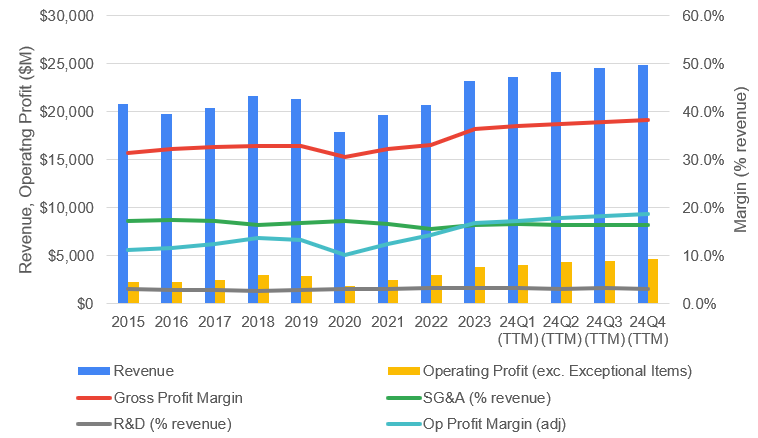
Net interest cover (interest expense, as charged to the income statement, relative to Earnings Before Interest and Taxes (EBIT)) has improved from 10 in 2015, to over 36 by the end of 2024 - Eaton’s debt is very manageable. After income tax at an effective tax rate of 16% (helped by having its corporate headquarters in Ireland), Eaton’s net profit margin is now running at over 15%, up from less than 10% in 2015.
In addition to growing profits and growing margins, Eaton has also embarked on significant reductions in the number of shares outstanding over the last ten years, although the majority of the share repurchases was completed before Covid. This has helped boost earnings per share (EPS).

To zoom out a little, this means that, since 2015, Eaton has:
increased revenue at a CAGR of 2%
increased gross profit at a CAGR of over 4%
increased operating profit and EBIT at a CAGR of almost 8%
increased net income attributable to ordinary shareholders at a CAGR of 7.5%
increased EPS at a CAGR of over 9%
The Balance Sheet
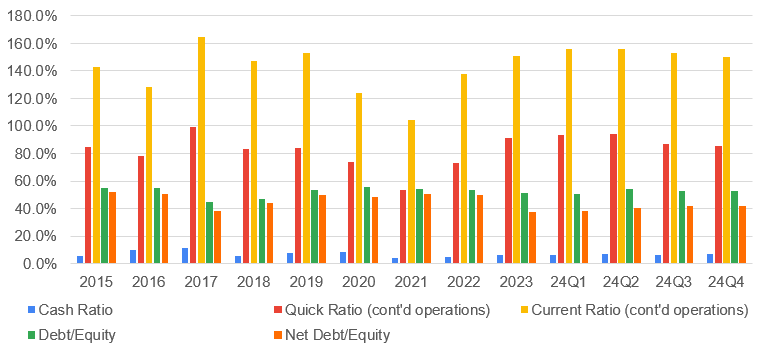
There are definitely a few points to draw attention to on Eaton’s balance sheet. The first is the relatively small amount of cash and highly liquid assets that Eaton carries. Eaton’s Cash Ratio (its cash and cash equivalents, relative to its current liabilities) has generally fluctuated before 4% and 7% since 2015, albeit reaching highs of 10% - 11% in 2016 and 2017, and 8% in 2019/2020.
Despite the low level of cash held, Eaton’s Quick Ratio (the sum of its cash, short-term investments and accounts receivable, relative to its current liabilities) is typically around 80%, having reached almost 100% in 2017, but dropping as low as 54% in 2021. This means Eaton can generally pay the majority (but not all) of its next year’s liabilities with a combination of cash, quickly accessible investments and money owed to it by customers. For the difference, Eaton would need to clear out inventory or generate new sales. With a Current Ratio of around 1.5 (or 150%), Eaton has ample inventory to be able to settle any residual current liabilities, so I personally don’t see the Cash Ratio or Quick Ratio as too much of a concern.
The second point to highlight is the level of corporate debt, which is running at a little over 50% debt-to-equity, or closer to 40% when looking at net debt to equity ratio (net debt defined as total debt, less cash and short-term investments). However, although this level of debt is moderately high, the debt is quite affordable at this time (as indicated by the interest cover, described above).
Looking at the debt interest paid up until 2023, as declared in Eaton’s annual reports, the effective interest rate paid on debt is under 4%, although it has been increasing recently. (N.B. The interest actually paid is different to the net interest expense declared on the income statement, as the latter will also consider any interest income from investments and any impact of amortised debt or early repayments.)
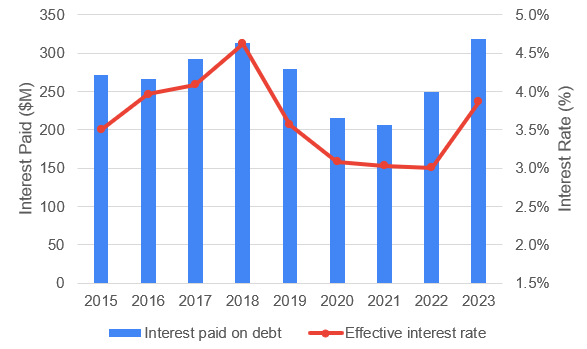
Figure 7 shows that interest payments have been increasing in 2022 and 2023. That is at least in part because Eaton increased the level of outstanding debt fairly significantly in 2021, 2022 and 2023. Although Eaton repaid a level of debt similar in magnitude to new debt taken on in 2022, the matured debt was predominantly at 2.75%, while the new debt was financed at 4.15% and 4.7%, pushing the effective interest rate up in subsequent years.
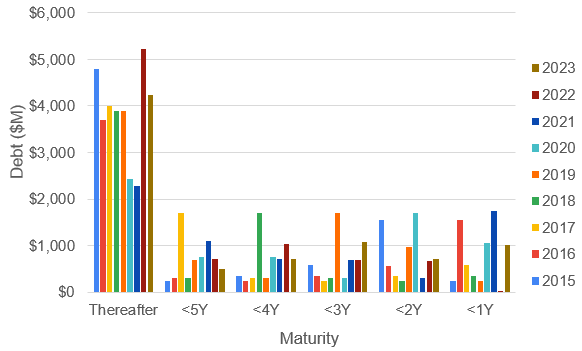
The large tranche of debt that was repaid in 2022 was unusually large for Eaton, at around $1.7 bn - annual debt maturities are more normally in the $500M to $1 bn range. There was a $1 bn debt maturing in 2024 and there is a further $1 bn due in 2026, but the majority of Eaton’s debt is very long-term and more than 5 years in the future. The $1 bn due in 2026 was financed at 0.128%, so it is highly unlikely that this would be re-financed and may lead to a fairly significant use of cash next year.
In short, although Eaton’s debt level is fairly high, and its effective interest rate is increasing, right now, its interest expenses remain well-covered by income.
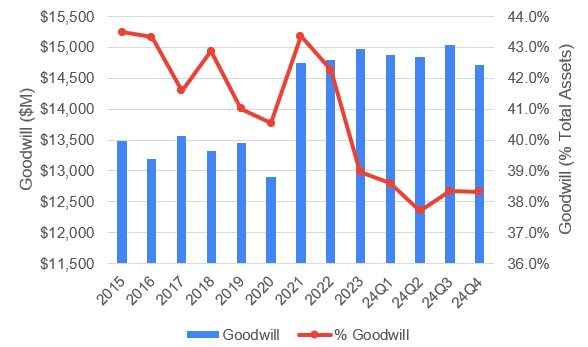
The last point I believe is worthy of attention on Eaton’s balance sheet is its level of Goodwill. Eaton carries a lot of goodwill, with almost two fifths of the value of its total assets being attributable to Goodwill (although this has dropped from over 43% in 2015, despite having a smaller magnitude of Goodwill recorded). There was a huge jump in Goodwill in 2021, due predominantly to Eaton’s acquisitions of Cobham Missile Systems within its Aerospace segment (increasing Goodwill by over $1 bn) and Tripp Lite within its Electrical Americas segment (increasing Goodwill by almost $1 bn).
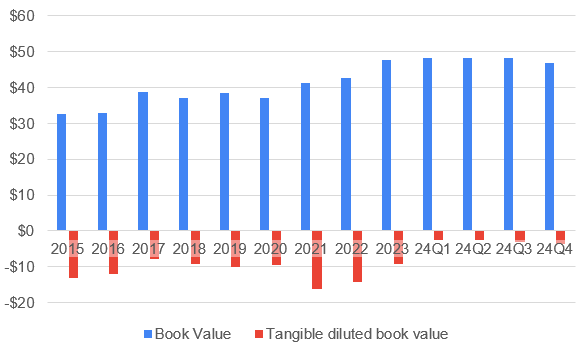
The consequence of this high level of Goodwill and debt means Eaton’s tangible book value is negative. Eaton’s nominal book value has been in the range of $45 - $50 per share over the last few years, whereas its tangible book value (nominal value, less goodwill, other intangible assets, deferred tax assets and I also discount finished goods and work-in-progress inventory) has been below zero since at least 2015. That said, in 2024, the tangible book value was only slightly negative, at -$3 to -$4 per share.
To summarise - the Eaton balance sheet definitely has a few elements that are less than ideal, and warrant continued attention, but nothing that looks like an absolute red flag to me.
Capital Management
Moving on, how is Eaton making the most of the capital at its disposal?
The first point to discuss is working capital management. As shown below, the level of inventory Eaton is carrying on its balance sheet has been increasing, relative to its cost of goods sold (COGS), to the point that it is now around the equivalent of 100 days’ worth of COGS. Accounts Receivable (the value owed to Eaton by its customers) has also tracked higher over time, although this is somewhat offset by increases in Accounts Payable (the money Eaton owes its suppliers). The net effect is that the cash conversion cycle (the equivalent time it takes from Eaton paying its suppliers, through creating goods for sale, to customers paying for goods received) has been increasing at a CAGR of just over 3% since 2015. So Eaton is allowing more capital to be held in its supply chain than was previously the case, although the twelve months to the end of 2024 did show a slight improvement. (There will be other elements of working capital that I have overlooked in this analysis, but I expect the cash conversion cycle to dominate changes in working capital.)

Looking at the cost of capital for Eaton, I believe the weighted average cost of capital (WACC) is around 10% currently. I have had to approximate the cost of debt for 2024, as without Eaton’s 2024 Annual Report, I am not clear on how much interest was paid in 2024 - I only have the interest expense charged to the income statement, which is often not the same thing. To approximate the cost of debt, I have taken the interest expense and scaled it by the ratio between 2023’s interest paid and interest expense charged. Eaton’s cost of equity has been helped by its 5-year Beta value coming more into line with the market over the period assessed1. Beta is currently around 1.05, i.e. close to the S&P 500 index. With this level of Beta, according to the Capital Asset Pricing Model (CAPM), I calculate Eaton’s cost of equity as currently around 13%. In effect, this means that an investor should expect returns of around 13% to warrant investing in this stock over investing in a market-tracking index fund, given the current risk-free rate of a little under 4.4%.

Having reviewed how much it is currently costing Eaton to access new capital, either through debt or new equity, it is time to look at how well Eaton then uses the capital at its disposal.
The first element is how Eaton uses its property, plant and equipment (PPE). And here, at least, it is a good news story. Over time, Eaton has been generating more dollars of revenue for each dollar it has invested in PPE, and it is currently converting each dollar of PPE into $6.67 of revenue, up from $5.85 in 2015.

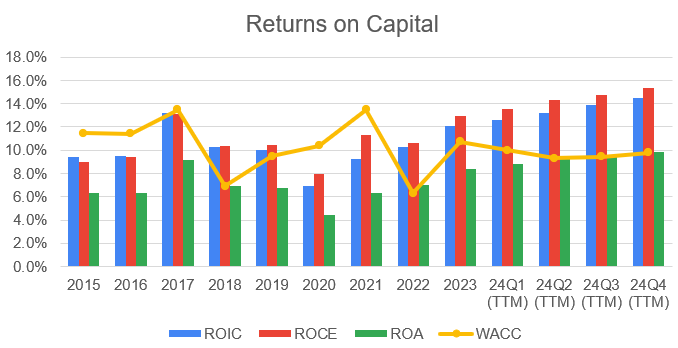
Eaton has generally been doing an increasingly good job of using its capital to generate returns. It now has Return on Assets (ROA) close to its weighted cost of capital (WACC), while both Return on Invested Capital (ROIC) and Return on Capital Employed (ROCE) have been increasing since 2020, having exceeded WACC since 2022. Currently, Eaton’s cost of capital is fairly flat, while its returns on capital continue to increase. This is a sign of a high-quality company, generating more money from its capital than it costs the company to bring in new capital.
Interestingly, ROCE is actually higher than ROIC, which is slightly unusual. ROCE is typically a broader metric, looking not only at invested capital, but all capital, less current liabilities. This implies that Eaton’s Earnings Before Interest and Taxes (EBIT) is growing more strongly than Net Operating Profit After Tax (NOPAT). Either way, the company is demonstrably stronger now than it was in 2015 - 2017.
Cash Flow and Earnings Quality
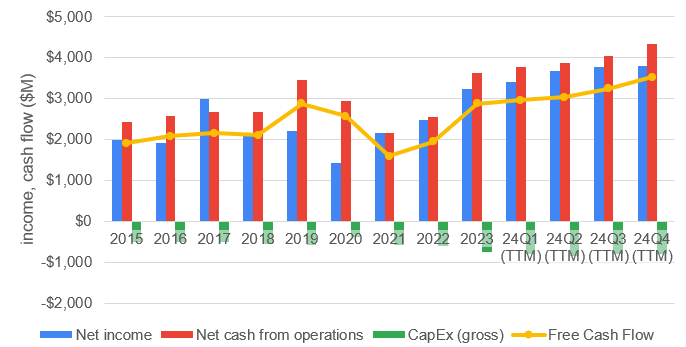
Eaton’s cash flows also corroborate my view of Eaton as a high-quality company - net cash from operations is higher than net income, meaning the company’s earnings are backed up by cash generation, and free cash flow (cash flow from operations less capital expenditure on PPE) is typically quite close to net income, implying the company is generating cash, that could be used for future investments or shareholder returns, at close to the same rate it is generating income.
It is instructive to consider Eaton’s Capital Expenditure (CapEx) with respect to its Depreciation & Amortisation expenses. Eaton helpfully provides its amortisation expense in the notes to their annual accounts, allowing me to back out the depreciation expense and compare it to CapEx. With this method, Eaton’s CapEx had been closely tracking its depreciation expense until 2018. In 2019, Eaton’s CapEx started to outpace depreciation. After a brief pullback in 2020, CapEx spending has accelerated since 2021, coming in at over 150% of the depreciation expense in 2023. Despite this, Eaton’s CapEx has remained around 3% of revenue and 15% of EBITDA (earnings before interest, taxes, depreciation and amortisation) since 2015. As shown by Free Cash Flow (FCF), this level of CapEx is easily affordable for Eaton.
With FCF running at 80% - 90% of net income after capital investments, Eaton has the majority of its earnings available for shareholder returns, debt reduction or acquisitions. Eaton has chosen to return a significant amount to its shareholders over time. Dividend per share has increased at almost 6% CAGR since 2015, while Eaton has invested around one third of its cumulative FCF generated in share repurchases since 2015. Dividend payout ratio has typically been in the range 40% - 55% (excluding 2020, when payout ratio reached 83% but a dividend was still paid).
Combining dividends and share repurchases, Eaton has typically been returning around 90% of FCF, on average, to shareholders between 2015 and 2022 (2023 excluded as there were no share repurchases).
Summary
To summarise the foregoing:
Eaton has consistently been growing revenue and earnings per share for a prolonged period of time
Eaton has strong profit margins, although not the strongest, in its peer group
Eaton’s Electrical Americas and Aerospace segments are particular highlights
Eaton are showing good control of operating expenses and are growing their profit margins currently
Eaton have a robust history of good cash generation and shareholder returns, despite increasing their capital investments recently
Eaton’s returns on capital are improving while their cost of capital is stable of decreasing - this bodes well for the future
Eaton has a decent balance sheet, but it is not without risk - they are carrying a lot of goodwill, a fair amount of debt, and seem to be investing more in working capital, relative to sales and cost of goods.
Valuation
So here’s the rub - Eaton is very, very expensive currently. It is trading at a price-to-earnings (P/E) ratio of around 30, having shot up after 2020 from the 10 - 20 range2. Price/sales has followed suit, increasing from 1 - 2 before 2020, to between 4.5 and 5 now.
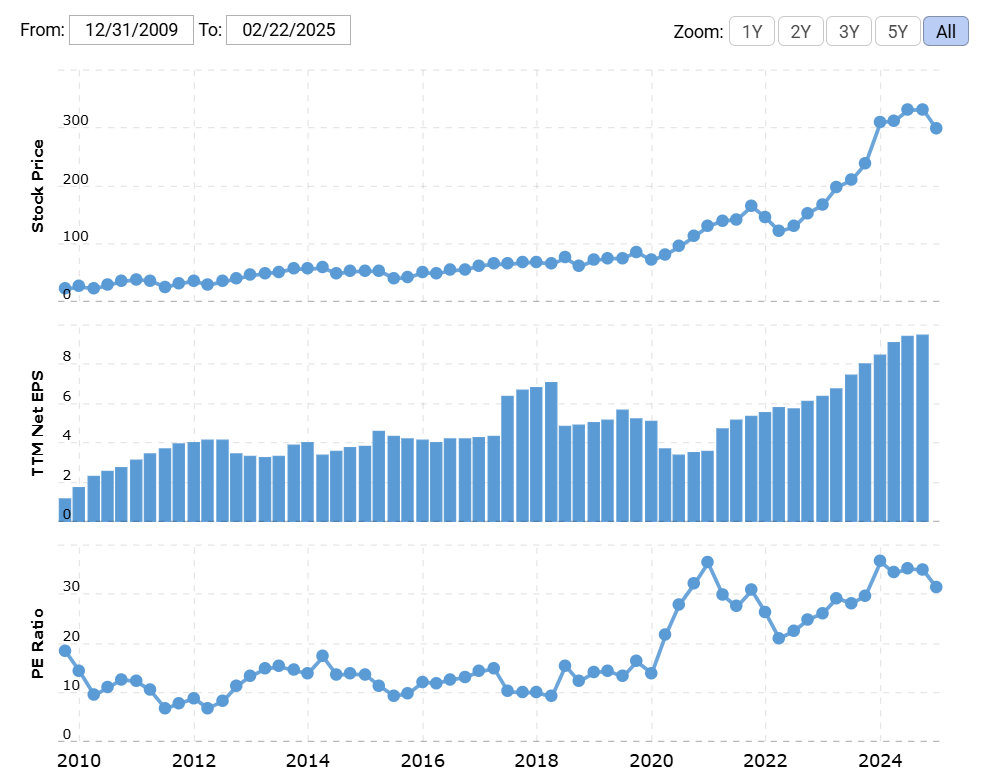
If I use my Monte Carlo valuation approach, excluding any contribution from book value due to the high level of intangibles, with the average growth rates seen since 2015, I estimate intrinsic value should be somewhere around $150. In fact, my very first ETN purchase was at around $130, before I moved to Trading 212.
With the current share price hovering around $300, this intrinsic value estimate is a long, long way below the current price. These growth rates are in line with Eaton’s own estimates of 7% - 9% for their organic revenue growth3. And is not far from Eaton’s own 2025 expectation of adjusted earnings per share of $11.80 - $12.20, up 11% at the mid-point from 2024’s $10.80.
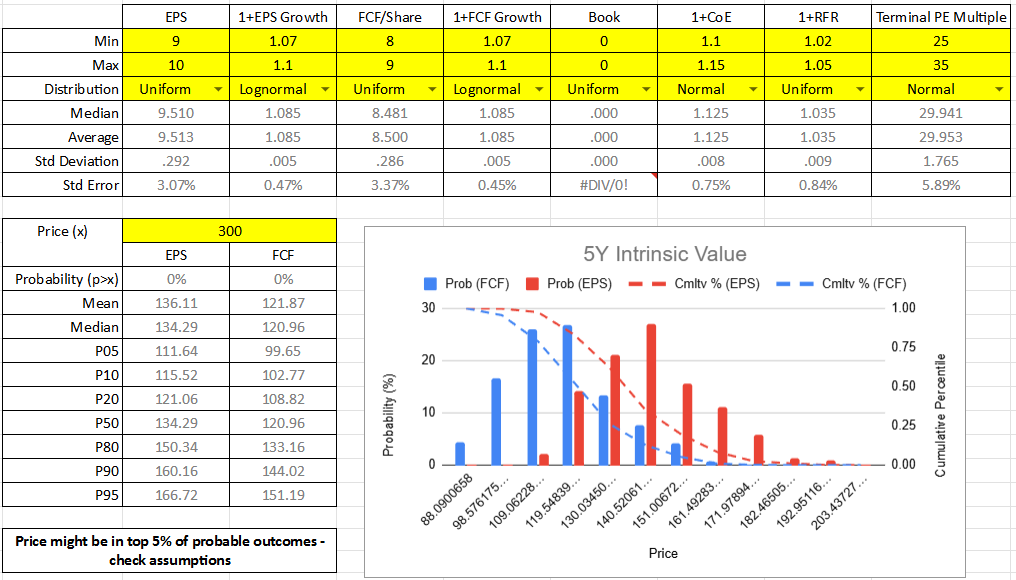
In fact, Eaton is generally guiding for growth in free cash flow of 5% - 15%, of organic growth in Electrical Americas of 10% - 12.5% and in Aerospace of 7% - 9%, and is expecting to spend between $2 bn and $2.4 bn on share re-purchases. Even with these adjustments, I estimate that intrinsic value is likely to be around $200 or less.
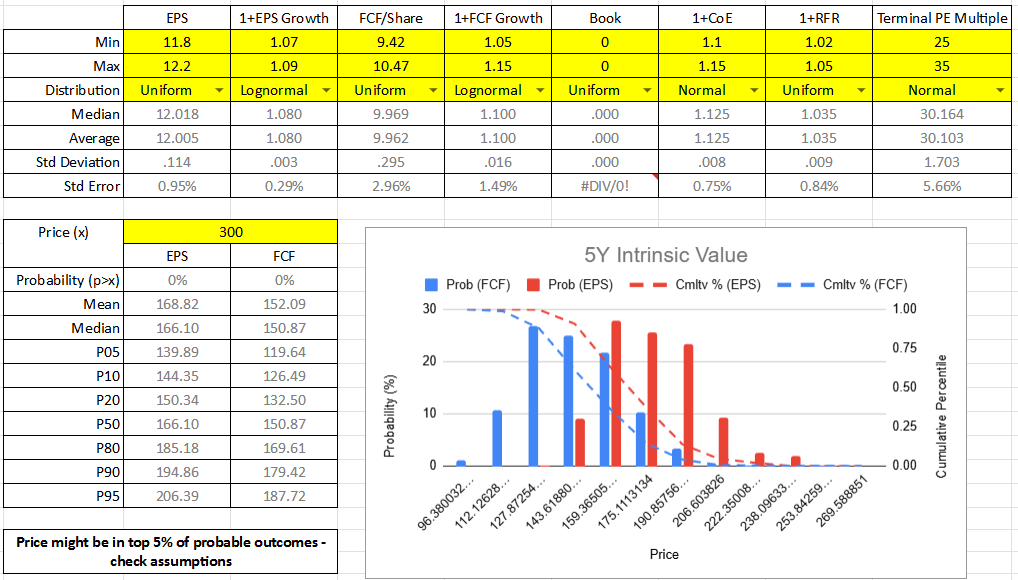
What kind of growth rate would it take to justify the current price of $300? With my reverse DCF calculations, I believe Eaton would have to post average annual growth rates of 25% - 30% over the next 5 years to justify the current price.
But is that unreasonable?
Eaton have started declaring the “mega projects” activity they are udertaking in their quarterly presentations, which notably includes a lot of data centre work. Data centres require a lot of power electronics, meaning they are very obvious customers for Eaton’s products. Eaton’s Electrical sector backlog stood at $11.8 bn in 2024 Q4, up from $2.8 bn at the end of 2019, a CAGR of 33%. Its Aerospace sector backlog was $3.7 bn, a CAGR of 21% since 2019. Eaton’s negotiation pipeline has been growing at 29% CAGR since 2019. As of the end of 2024, there was $8.6 bn under negotiation, and Eaton had a win rate of around 40%, indicating possible future revenues of almost $3.5 bn. The combined pipeline and negotiations therefore could be worth $19 bn. Even with the current 11% cancellation rate, this is around two thirds of 2024’s revenue, and indicates fairly secure revenue for years to come (as we can assume the negotiation pipeline will continue to fill with new requests as the current negotiations conclude).
Conclusions
In my view, Eaton is a high-quality company, but it is expensive. If the price were to drop to $200, I would think this would be a very easy purchase to justify. At $300, you have to believe growth rates of 25% or more are feasible, and be willing to buy in to an industrial company at a P/E ratio of around 30. Which maybe you can justify to yourself if you believe data centre demand will continue to grow rapidly over the next few years.
I’m not ruling out adding to my holding. Since joining Trading 212, I have an average purchase price of $243, a bit higher than if my total purchase history were to be considered. However, this still shows that I am willing to pay a premium to invest in Eaton at this time, given my intrinsic value assessment. But at almost 9% of my individual stock portfolio, it is already a sizeable holding, so I think I’d be looking for better value to add to my holding currently. It’s a “hold” for me for now.
https://www.zacks.com/stock/chart/ETN/fundamental/beta
https://www.macrotrends.net/stocks/charts/ETN/eaton/pe-ratio
https://www.eaton.com/content/dam/eaton/company/investor-relations/quarterly-earnings/filings/2024/q4/4Q-2024-analyst-presentation.pdf
Eaton is one of the leaders in this segment and this is a nicely written deep dive with a lot to take in. I agree with the analysis that Eaton is trading at an expensive valuation and will need outsized growth to justify this stock price. However, I think this is the same for the other US based competitors highlighted also like Vertiv. Also, for a more accurate comparison of industry peers Siemens Energy needs to be replaced by Siemens AG as it is the latter that competes directly with Eaton and not the former as both, the electrification and automation business of Siemens is housed in Siemens AG and not Siemens Energy. Would be interested in getting your thoughts on how Siemens AG stacks up to Eaton as in my opinion Siemens is performing extremely well and doesn’t carry as high a valuation as Eaton and has more room to grow.