


Renting v. Buying in the UK - which is more profitable?
Are you likely to make more money through owning your home, or renting and investing the difference?

I have heard it said that “renting is the most you’ll pay for housing, and a mortgage is the least you’ll pay for housing” (credit to TheBossHog, and whoever he was citing at the time). The logic is that renting is probably more expensive than owning, but at least you don’t have the additional expenses of home ownership, such as insurances and maintenance. So a mortgage becomes the minimum cost of housing, while rent is often the maximum.
I’ve also recently seen a number of people citing the recent performance of the market as justification to continue to rent and invest the money that would otherwise become a home deposit in the market instead. Or people wanting to invest their deposit in the market while they are accruing and saving. This is clearly a riskier strategy than saving in a fixed-interest savings account, but as always it will depend on the risk appetite and timeframe of the investor.
So can we determine which strategy is most likely to be successful? I built a model to try and find out.
The Model
I built a present value model, considering likely mortgage costs, house prices and historical growth rates, rental yields, market returns, mortgage rates and inflation rates.
I start with a randomly-selected Loan to Value mortgage and a randomly-selected rate of inflation (derived from historical data). I assume a mortgage term of 30 years and a house price of £249,000, which was the average price of a home for first-time buyers in January 20241. This sets an amount of capital required as a deposit to get that mortgage and the monthly mortgage repayment for those 30 years. I do not consider re-mortgaging throughout that term, even though it is likely that most people would re-mortgage at various times.
I then randomly select a rental yield that would likely be paid if the same house were to be rented instead of being bought. I assume the difference between the deposit and twelve months’ of mortgage payments, vs. twelve months’ of rental payments, is then invested in the market, at which point it is subject to a randomly-selected annualised market performance. This means the total amount of capital being used for the first twelve months is equivalent between renting or buying. I assume any additional capital that an individual may have would be invested in either case, and therefore the returns on that excess capital would be equivalent, whether renting or buying. The only money which may perform differently is that money being used to acquire and service the mortgage vs. rent.
I assume rental yield does not change throughout the 30 year timeframe being compared, but the actual rent being paid increases as the value of the house changes with time. Each year for the 30-year duration of the mortgage, the difference between twelve months’ of mortgage payments and twelve months’ of rental payments is added to, or extracted from, the amount of capital invested in the market. The logic here is that the mortgage sets the ‘reference’ amount of money required for housing costs, and therefore the assumption is that there is no more capital available with which to fund rents.
I run the model with these assumptions for the 30-year duration of the mortgage, discounting each year by the cumulative effect of inflation over that time period. I can then compare the net present value after a 30-year period of the final value of home equity, less mortgage costs, against 30 years of rental costs and market investments.
As there are many variables here (mortgage rates, inflation, loan-to-value, rental yield, market returns), I run the model 50 times (it’s quite a manual process, so I couldn’t go nuts and generate 1000s of options) to generate a range of potential outcomes.
The Inputs
Loan-to-Value and Mortgage Rate
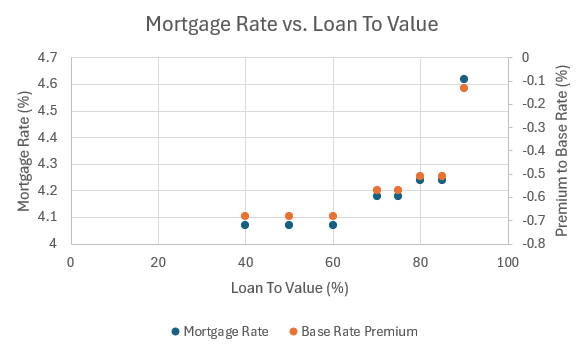
Using MoneySavingExpert’s Mortgage Best Buys finder2, I find the best mortgage rate currently available for the average first-time buyer property value (£249k) for a range of Loan-to-Value (LTV) rates. At the time of writing, the Bank of England (BoE) base rate if 4.75%, so I compare the best mortgage rate available for each LTV point as a premium to that rate. The results are shown in Figure 1, and show that the best mortgage rate on offer varies from 0.1% below the BoE base rate at high LTV, to almost 0.7% below the BoE base rate at low LTV.
It is unreasonable to expect that mortgage lenders will ALWAYS offer mortgages at below base rates - when base rates were extremely low for the decade following the 2008 financial crisis, mortgage rates were lower than they were today, but they were higher than the BoE base rate. Looking at the history of UK mortgage rates since 20003, it is clear that rates dropped over the 20 years between 2000 and Covid, to a low of around 2%, but have then increased as the BoE base rate has also increased (Figure 2).

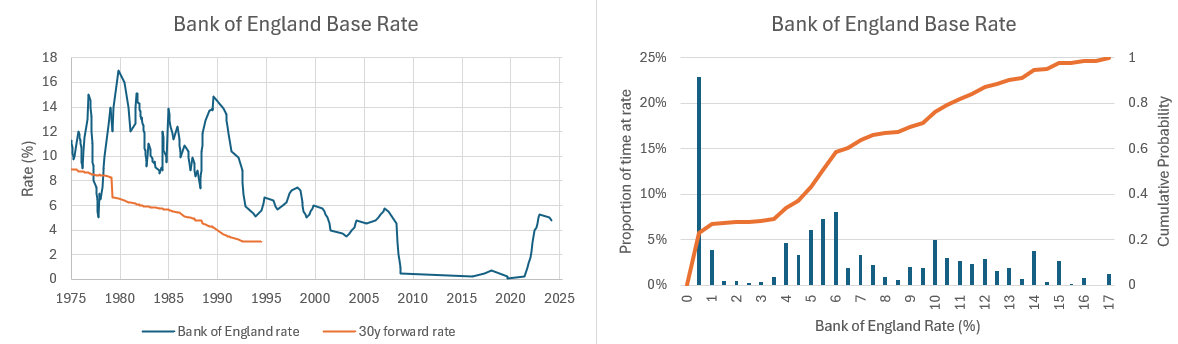
The Bank of England publishes the current base rate and historical rates for the last 50 years (back to January 1975)4. When these rates are charted, it becomes clear that the 1970s and 1980s saw very high and very volatile interest rates, but also that the prolonged period at rates below 1% seen in the 2010s was unprecedented. The median BoE base rate seen over the last 50 years is between 5.5% and 6%. This data set also allows us to calculate the annualised base rate seen for the subsequent 30 years for the period 1975 to 1994. This analysis shows that the annualised 30-year rate has dropped over that time period, but did show some stagnation at around 3% at the end of the data set (explained by the prolonged period at constant rate leading up to 2020, with the rapid increases over the last few years offsetting some of that low-interest-rate period). In other words, base rates in the range 3% to 5% are actually very common, and more likely to be representative over the period of a mortgage than the < 1% experienced for most of the 21st Century.
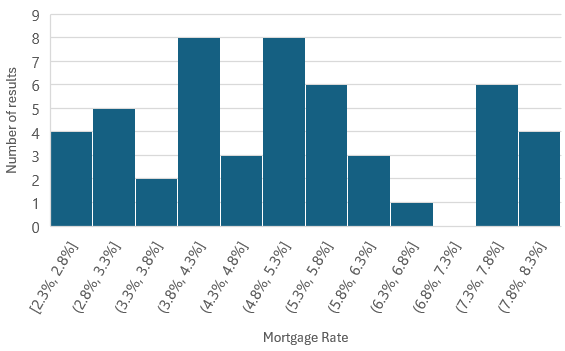
Combining these data sources, I randomly select a loan-to-value between 60%, 70%, 80% and 90% (as there is no improvement in mortgage rate premium below 60% LTV) and I randomly select a number to represent the percentile of the 30-year annualised base rate, to the nearest 0.5% interest rate. I then set the mortgage rate to be the higher of the base rate + the LTV premium, or 2%. Figure 4 shows the range and frequency of mortgage rates selected by the model. Although there were instances of choosing a high mortgage rate of 7% - 8%, representing roughly the 30 years between the 1970s and the late 1990s, it was more frequent that rates of around 4% and 5% were chosen, similar to the rates being seen in the market today.
Mortgage payments are calculated using the following formula5:
monthly payment = (rate * principal) / (1 - (1 + rate)^(-1 * repayment term [yrs] * 12))
Inflation
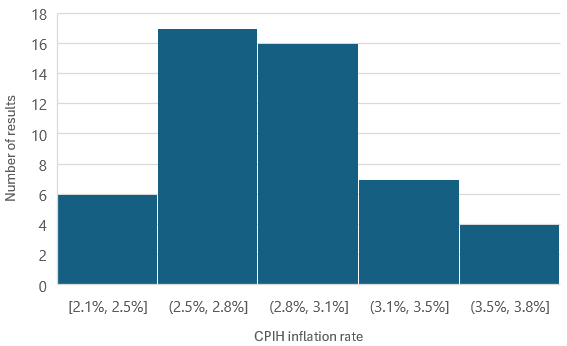
Using annual data for Consumer Price Inflation, including Owner-Occupier Housing Costs (CPIH)6 for the period 1989 to November 2024, it is clear from Figure 5 that CPIH was most commonly around 2.5%. The data actually fits a lognormal distribution reasonably well (Figure 5). CPIH was explicitly chosen as we are trying to consider the inflation rate for homeowners. The model fit shows that the model is less likely to select inflation rates between 2% and 3%, and more likely to select inflation rates between 3.5% and 6%, than has been seen in the historical record, which will have the effect of depressing the present value for these calculations.

For my model, a random number is again used to select the percentile of the distribution of CPIH results to use, assuming the lognormal approximation is reasonable. The inflation rate for each year of the 30-year mortgage period is independently calculated as above (meaning my model does not allow for persistent, multi-year bouts of high or low inflation and assumes inflation can change randomly from one year to the next). The cumulative effect of the 30 years of inflation data can then be aggregated and represented as an effective annualised inflation rate. Figure 6 shows that, with this approach, the cumulative effect of inflation over the 30 year period is typically 2.5% to 3% annualised.
House Price Growth
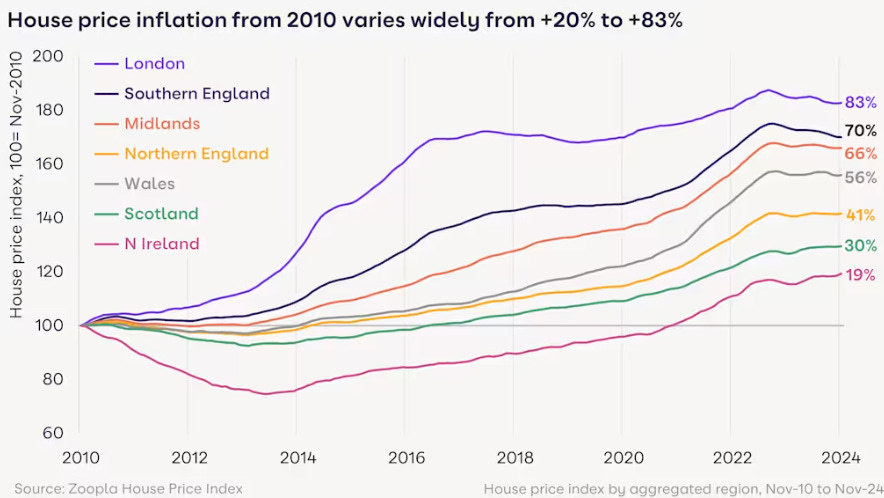
House price growth was very strong in the 2000s, leading up to the sub-prime mortgage issues and the 2008 financial crisis. During the crisis, prices dropped back roughly 20% and, after a couple of years of stagnant growth, prices again rose rapidly, at least in some regions (and particularly so in London), in the decade between 2010 and 2020, and again following Covid. Since 1983, average UK house price growth has averaged 6% per annum, however, since 2010, growth has been less pronounced, with house price growth of between 1.3% per annum in Northern Ireland and 4.4% per annum in London. Over the last year, house price growth has been 1.9%, and is expected to be around 2.5% in 20257.

For my model, I have assumed a normal distribution of house price growth around the regional average of 3% and standard deviation of 1%. This provides the following distribution of annualised house price growth rates:
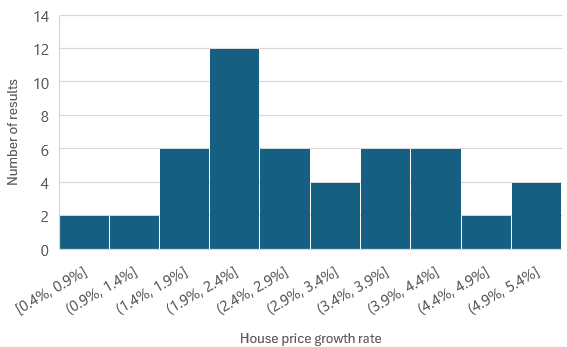
The model generally assumes a slightly lower growth rate than may have been expected, with a growth of around 2% being the most common. However, this will mean that the modelled results are simply a bit more conservative than may be experienced in real life. This also means that house price growth, and therefore home equity growth, is generally lower than the assumed mortgage rates.
Home equity is calculated each year as the difference between the compounded house price growth and residual mortgage amount, considering the principal, interest accrued at the selected mortgage rate, less repayments made.
Rental Yield
Zoopla has collated the average rental yields seen in a number of UK cities, as of April 20248. I have selected the highest and lowest yields from this list for each of the geographic regions from Zoopla’s house price index (reference 7), assuming these cities offer the rental yields indicative of the whole region. As might be expected, the lowest yields are typically in the regions with the highest house prices and the highest yields in the lower-priced regions, however, there is also a very wide spread between cities with the highest and lowest yields in a given region (for example, in the north of England).

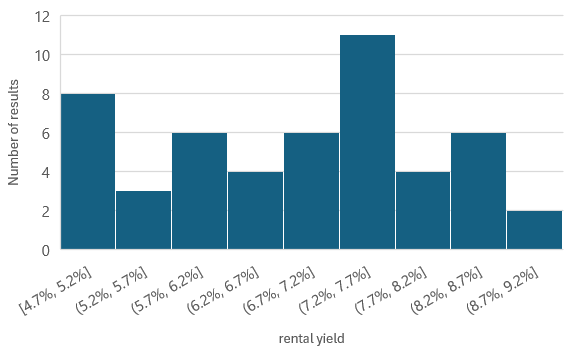
For the model, I have assumed the rental yield is randomly distributed between the minimum and maximum yields from Zoopla, which has produced a distribution with a minimum yield of 4.7% and a maximum yield of 8.8%, with ~7.5% being most commonly sampled.
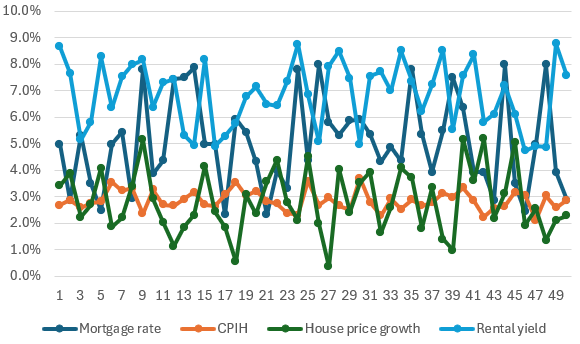
When all of these inputs are put together, the following chart for each of the 50 analyses is generated (Figure 12). In general, average inflation over the 30-year period sits between 2% and 3%, rental yield is higher than mortgage rates, mortgage rates are often higher than house price growth rates, and house price growth is sometimes higher and sometimes lower than the average rate of inflation.
Market returns
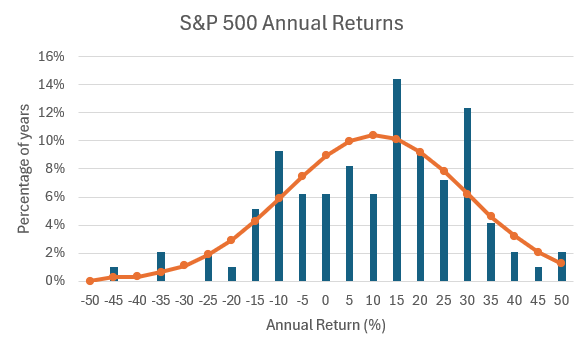
Assuming the S&P 500 annual returns represents the distribution of returns possible from investments, I have used data from MacroTrends9 to generate a distribution of annual returns from investments in the market, considering 97 years of annual returns from 1928 to 2024 (inclusive). This data indicates annual returns of between -47% (seen in 1931) and +47% (seen in 1933), with a standard deviation of 19%. Despite this volatility, the average annual returns from the S&P 500 have been 6% - 8% (depending on whether the geometric or arithmetic mean is chosen, respectively).
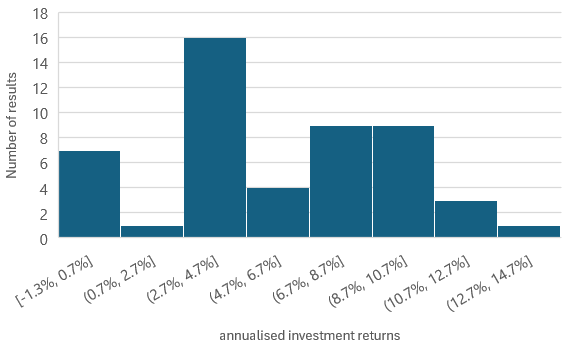
Significantly, assuming a normal distribution for returns overweights the likelihood of getting -5% to +10%, and underweights the likelihood of ~ returns around -10%, +15% or +30%. For this reason, I have chosen to use the distribution of real annual returns, rather than assuming returns are normally distributed. I have also calculated the annualised returns, considering the cumulative returns generated and sequence of returns. Although returns in the range 7% - 10% are common, so are cumulative returns in the 3% - 4% window. Although no 30-year period has ever produced negative returns, the random sampling approach I have used for this model shows that it would be possible to generate negative returns, but it would likely require another event like the Great Depression.
The Outputs
So what does this mean for the present value of home ownership?
32 of the 50 analyses provided a net present value for home ownership of less than zero, with home ownership frequently costing the equivalent of £63k to £113k. However, in 13 of the cases the net present value is positive, sometimes by hundreds of thousands of pounds.

There is quite a strong relationship between profits made from home ownership and the difference between the mortgage rate and house price growth rate (Figure 15). Although there is still a lot of variation, in general, home ownership provides positive returns when house price growth rate is close to, or greater than, the mortgage rate, and negative when mortgage rates are greater than house price growth rates. With mortgage rates currently around 4% - 5%, this is currently quite a high bar to clear.

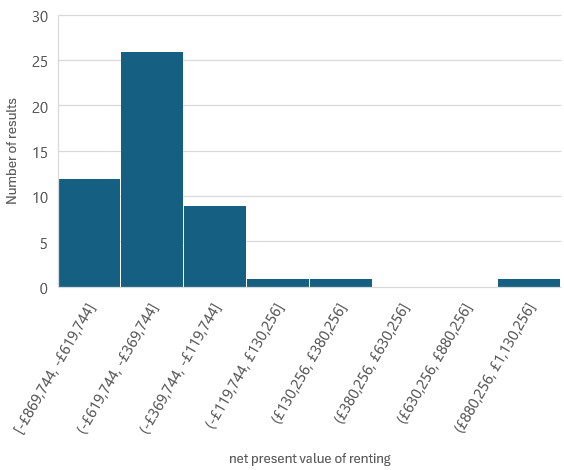
However, the net present value of rental generally fairs worse. In 47 of the 50 cases, the net present value of a combined renting and investing approach is negative. In one case, this approach is highly lucrative (the annualised investment rate of return for this case was 14.5%), but most commonly, the combined benefit from renting and investing costs between £370k and £620k (figure 16).
In 40 of the 50 cases, the investment fund is depleted before the 30 years has elapsed. In the worst case, the fund is depleted within 4 years, although more commonly the fund lasts around a decade, and in 24% of cases the fund can last two decades (figure 17). In 20% of cases, the investment funds lasts the full 30 years.

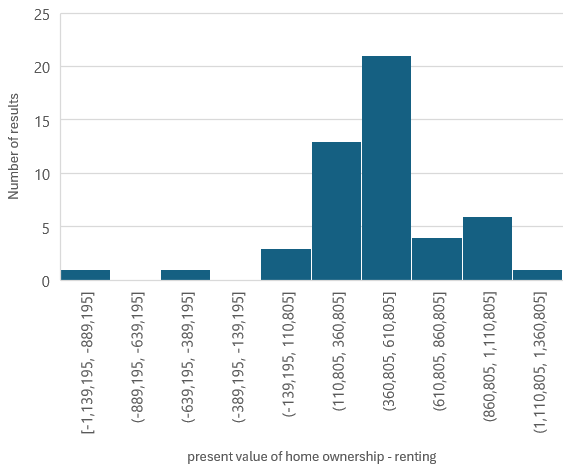
Although the inputs have been randomly assigned for each of the 50 cases, and therefore the particular combination of market returns, inflation, rental yield, mortgage rate and house price growth is just luck, it is possible to see by how much home ownership is beneficial for the 50 random combinations of inputs assessed. In general, home ownership is preferable to renting by the equivalent of between £110k and £610k over the 30 years of mortgage repayments, most commonly by £400k to £600k. In the two cases where renting and investing appears beneficial to home ownership, market returns are high (10.8% and 14.5% annualised) and mortgage rates are around 8%. It is probably unlikely that these combinations would occur together and be sustained over the 30 years assumed here.
Conclusion
Most often, home ownership is preferable to renting, although it is quite likely that both approaches will cost money over a wide range of macro-economic conditions. However, we all have to live somewhere! The probability of becoming profitable is higher for home ownership than from investing and renting. It looks like home ownership is likely to be a better investment in the long run.
https://www.gov.uk/government/news/uk-house-price-index-for-january-2024
https://www.moneysavingexpert.com/mortgages/best-buys/
https://www.mortgageable.co.uk/mortgages/history-of-mortgage-interest-rates/
https://www.bankofengland.co.uk/boeapps/database/Bank-Rate.asp
https://en.wikipedia.org/wiki/Mortgage_calculator
https://www.ons.gov.uk/economy/inflationandpriceindices/timeseries/l55o/mm23
https://www.zoopla.co.uk/discover/property-news/house-price-index/
https://www.zoopla.co.uk/discover/property-news/best-buy-to-let-locations/
https://www.macrotrends.net/2526/sp-500-historical-annual-returns