


What Went Wrong? Leoni AG
Lifting the lid on a major automotive Tier 1 collapse

After I wrote my Eaton Deep Dive (link embedded below), a conversation with the user NoRiskNoFun on the Trading 212 forums brought up the topic of the collapse of companies like Leoni and Varta - companies that had seemed to be doing well and then rapidly collapsed. The topic intrigued me, so I thought I’d look into Leoni and ask, even with the benefit of hindsight, would I have spotted the signs?
Deep Dive: Eaton Corporation (NYSE:ETN)

Eaton Corporation ( ) are one of my main holdings. At the time of writing, Eaton are my 3rd-largest individual holding, accounting for almost 9% of my individual stocks portfolio.
LEONI AG - Synopsis
In 2017, LEONI celebrated its centenary, having been founded as Leonische Werke Roth-Nürnberg AG from the merger of several companies. From there, it developed a specialism in cables and wiring and grew, both organically and through a number of acquisitions, to become a major supplier with a strong global presence.
Going back to their 2016 Annual Report (sourced from AnnualReports.com1, as LEONI’s current investors / public relations website no longer hosts these reports), LEONI was organised into “Wire & Cable Solutions” and “Wiring Systems” divisions. Both divisions held domestic and foreign companies, covering Asia, the Americas and EMEA (Europe, Middle East and Africa).
The Wiring Systems division serviced customers principally in automotive, commercial vehicle, agriculture and power sports industries, and included products across low-voltage and high-voltage harnesses, with power distribution and plastic components and connectors.
The Wire & Cable Solutions division covered copper, optical and hybrid cables. Its major markets were automotive, industrial automation and robotics, medical technology, transportation and renewable energy.
In 2021, shareholder Pierer Industrie AG launched a bid to increase their shareholding from 15.3% of voting rights in LEONI to 24.9% of voting rights. Over the course of 2022 and early 2023, LEONI fell into severe financial difficulties, following the collapse of the sale of one of their business groups (Automotive Cables). This led to an urgent need to re-finance and, ultimately, the company failed.
In January 2023, Hans-Joachim Ziem was appointed to the Board as Chief Restructuring Officer2. In March 2023, a restructuring plan was provided to the Nuremburg Restructuring Court3 4, which provided for a reduction in total debt of just under 50%, in return for the cancelation of existing share equity and delisting of LEONI from public markets (at this point, the equity was worthless in any case). New shares would then be issued by LEONI to a company run by Stefan Pierer for total capital of €150M, making Stefan Pierer ultimately the sole shareholder of newly-private LEONI AG. LEONI’s remaining debt liabilities were transferred to Pierer’s company (now sole shareholder of LEONI AG), L2 Beteiligungs GmbH. LEONI’s creditors received equity in L2 in exchange for forgiving money owed by LEONI, meaning new profits generated by LEONI in the future (now free of its original debt obligations) would increase the equity of L2 and thereby be returned to LEONI’s original creditors. This permitted LEONI to continue trading, but the bottom line for LEONI’s original shareholders was that they were wiped out and could not participate in any resurgence of LEONI in the future. This plan was approved in Nuremberg courts in May 20235, to take effect in June 2023.
What were the signs LEONI was in trouble?
Divisional Breakdown
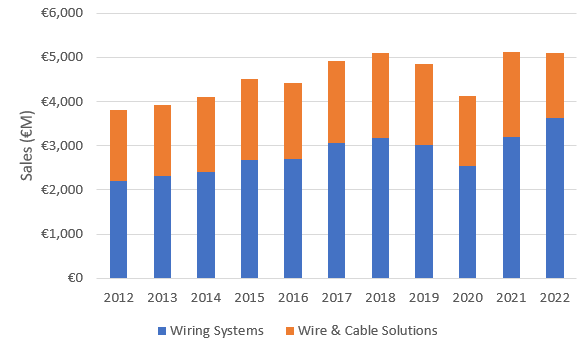
I think it is very informative to review LEONI’s annual reports. Excluding 2019/2020, LEONI’s revenue was growing throughout the period 2016 to 2018, growing at an average Compounded Annual Growth Rate (CAGR) of around 4% during this time, with 2021 and 2022 revenues being similar to 2018 (implying a CAGR of around 2% from 2015 to 2022). The majority of revenue growth was generated within the Wiring Systems division, which posted a 10-year CAGR of over 5% between 2012 and 2022, whereas the Wire & Cable Solutions division was ultimately flat in revenue between 2012 and 2022. This flat performance was almost totally caused by the 24% drop in revenue between 2021 and 2022 - between 2012 and 2021, Wire & Cable Systems had generated a CAGR of around 2%.
Wiring Systems accounted for around 60% of revenues throughout this period, until 2022, when it jumped to 70% as the Wire & Cable Solutions revenue dropped badly.
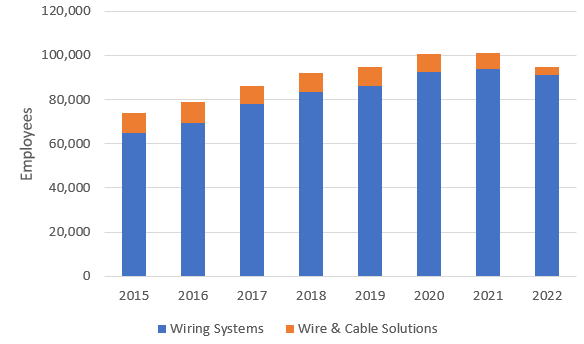
and looking at LEONI’s employee count, you could also be forgiven that things were looking good through the majority of this period. 2021 was fairly flat in terms of headcount and 2022 saw a severe contraction in the number of employees within the Wire & Cable Solutions division, but Leoni was still a global employer of 90,000 to 100,000 people, with the vast majority employed within the Wiring Systems division. Employee count increased at a rate of 4% - 5% between 2016 and 2021 - 2022 (5% by 2021, 4% by 2022).
So, there was evidence of one division of LEONI struggling, but not sufficiently to explain the company’s collapse - up until 2021, the company was still growing its revenue and employee count. But what of gross profit and earnings before interest and taxes (EBIT)?
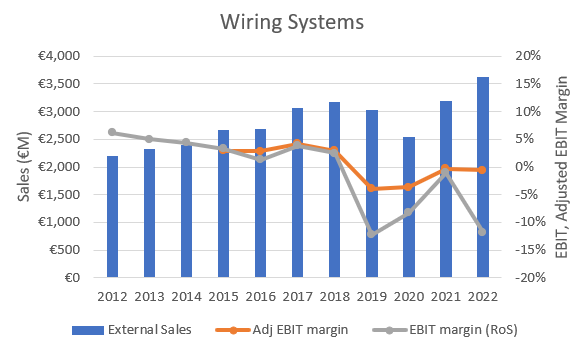
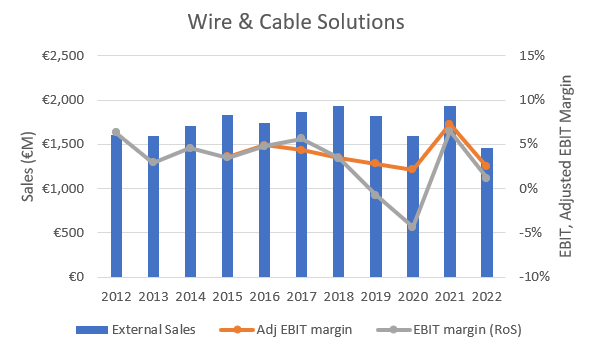
This is where, for me, the first warning signs start to become apparent when looking at profit margins. As shown below, margins in Wiring Systems have been dropping since 2012, but since 2019 the EBIT margins have been negative. Of particular interest, the ‘adjusted’ EBIT margin has been quite different to the statutory EBIT margin. This indicates a lot of ‘adjusting’ items, suggesting management believe there are a lot of ‘extraordinary’ expenses that impact the bottom line but don’t reflect the performance of the underlying business. I am always suspicious when there is a large difference between ‘adjusted’ and statutory earnings. The same trends are broadly true of Wire & Cable Solutions, but in that case, the EBIT margins remained positive, excluding the Covid-affected years in 2019 and 2020.
As Wiring Systems is the larger contributor of the two divisions, it is particularly important to understand the causes of the negative EBIT margin and differences between adjusted and statutory earnings. However, at the start of 2022 you could have been forgiven for thinking the company was getting back to profitability, reasonably assuming 2019 and 2020 were indeed extraordinary years. You could have been quite hopeful that 2022 would mark the start of a resurgence.
In LEONI’s case, the adjustments in 2019 and 2020 were largely direct Covid-related costs, impairment charges, charges to provisions for contingent losses (i.e. customers cancelling or reneging on contracts) and restructuring costs under their VALUE 21 initiation (intended to streamline procurement, production, logistics and IT costs). There were also adjustments for strategic decisions, refinancing costs, costs to prepare Wire & Cable Solutions for a spin-out (part of LEONI’s strategic direction, stated in 2018) and consulting fees. I will leave it up to the reader to decide which of these are genuinely ‘extraordinary’ and which should be considered business-as-usual. Suffice to say, I put more weight on the statutory EBIT than the adjusted EBIT in LEONI’s case.
Corporate Margins
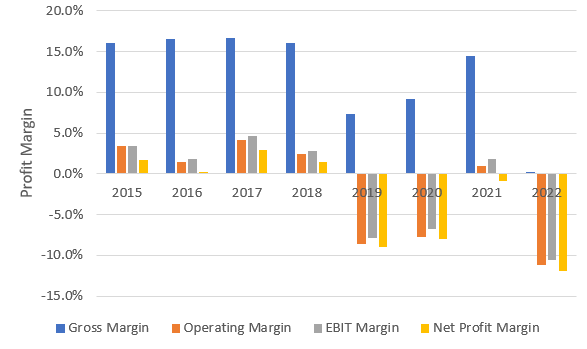
Looking at overall margins, a few things jump out to me. Firstly, gross margins were pretty low, at less than 20%. Secondly, operating margin (i.e. earnings before interest, taxes and income from joint ventures and associates, relative to sales) were very low, at below 5%. This really didn’t leave much margin for interest and tax costs, or to absorb shocks, as evidenced in 2019 and 2020. And, importantly for me, in 2021, when gross margin was again growing, other profit margins remained depressed. Digging into the numbers, it is apparent that LEONI’s 2021 bottom line was helped by disposal of LEONI Schweiz AG, but LEONI also faced a large tax bill outside of Germany, and a substantial increase in financing costs related to bank loans. This should have highlighted a few warning flags for the future, but I’m not sure it foreshadowed to total collapse in gross profit in 2022, causes by a large increase in the Cost of Goods Sold (COGS), itself primarily due to impairment charges of over €500M on non-current assets, relating to shutting a facility in Germany and the war in Ukraine.
Liquidity
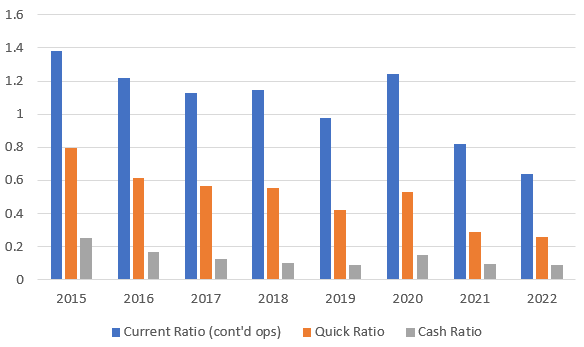
So, with such thin margins, how was LEONI’s balance sheet? For me, moderately worrying, but perhaps not obviously alarming, at least, not until Covid. Current Ratio, i.e. the ratio of current assets to current liabilities, was generally above 1, excluding 2019, but dipped badly in 2021 after showing a recovery in 2020. The same is true of Quick Ratio, and Cash Ratio. Cash Ratio, for me, was particularly concerning, having dropped from above 20% in 2015 to lows of 9%. For a company with such low profit margins, this indicated that LEONI really didn’t have much cash available, and had allowed its cash position to be eroded even before Covid, which was a precarious position in hindsight.
Debt and Equity
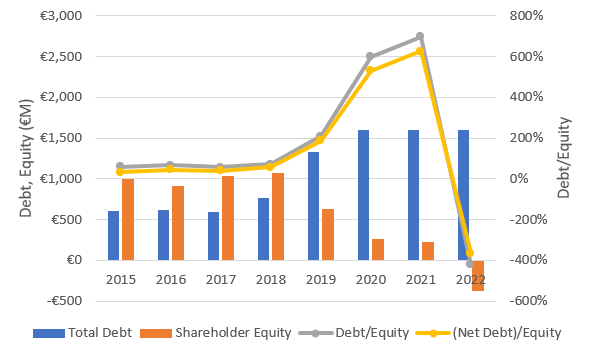
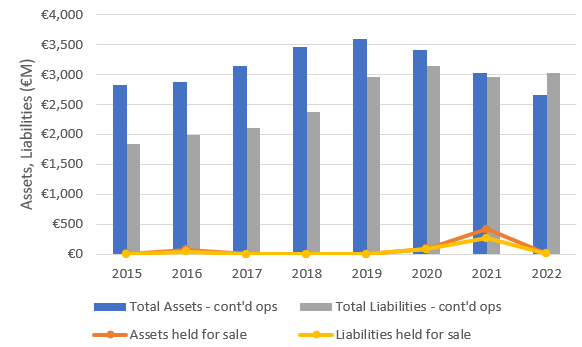
So, if LEONI didn’t hold much cash, where did its liquidity come from? The short answer is debt (even though it was immediately utilised, and not allowed to sit as cash on the balance sheet). Debt started to tick up in 2018, before accelerating rapidly in 2019 and 2020. More worryingly, LEONI’s book value started plummeting at the same time, showing the increase in asset value was not keeping pace with the increase in debt. The biggest red flag is that LEONI started selling assets in 2020 and particularly in 2021, meaning by 2022 the liabilities of its remaining operations exceeded its remaining assets, making shareholder equity worthless on paper.
One reason for the assets dropping had been regular impairments of goodwill, with particularly abrupt drops in 2021, before being wholly written down in 2022. Even though goodwill wasn’t a substantial proportion of total asset value in the first place, loss of 5% of total asset value over 5 - 6 years with increasing liabilities didn’t help, and highlights the precarious nature of goodwill on any company’s balance sheet - it can just dissipate when times get tough.

Looking more closely at LEONI’s debt burden, the shift post-2020 to increased short-term debt and low cash reserves becomes very obvious. In 2015 and 2016, LEONI had sufficient cash to pay their short-term debts, but in 2017 and 2018, the reduction in cash led to a very fine balance between cash and short-term debt liabilities. In 2019, short-term debt liabilities exceeded cash reserves while, at the same time, total debt increased abruptly. A lot of this debt was converted to long-term debt in 2020, but by 2021 and 2022, that long-term debt was converting back to short-term debt, which now far exceeded cash reserves. Reading through the notes to the accounts, it is clear that some of the liabilities due in 2022 were extended to 2023 during the year, meaning the same debt could appear as current liabilities in both 2021 and 2022, itself a warning sign, but one that would not have been apparent to investors until some point during 2022.

Cost of Capital
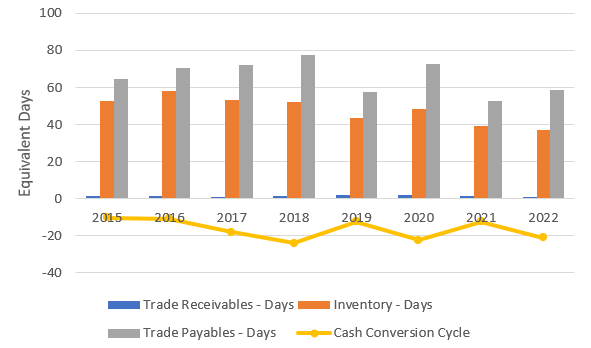
One reason LEONI may have felt they could survive with low cash balances is because they had an advantageous working capital structure. LEONI carried the equivalent of of one to two months of inventory and received payments from customers within the equivalent of a handful of days (trade receivables), but typically paid suppliers on the equivalent of 60 days - 90 days in arrears (trade payables). This meant LEONI typically received cash from customers before having to pay their suppliers, and in sufficient quantity to offset the level of inventory being carried. This had the effect of bringing cash into the business around 10 - 20 days before it had to be spent to either create products or pay suppliers. This is an extremely lean business model and means LEONI would rarely have had to dip into their cash reserves to provide working capital during normal business.
Looking at LEONI’s cost of capital, despite the movement towards increased debt levels from 2018, LEONI’s effective cost of debt (interest charges as a fraction of total debt) did not increase too aggressively, remaining quite affordable even up to 2022, at less than 4%. The cost of equity had been fairly stable at around 10%, until the S&P 500 index performance raced up in 2020 and 2021, coupled with reduced treasury yields, before pulling back in 2022. With a beta value of 1.3 - 1.4, LEONI’s inferred cost of equity was magnified compared to the average market equity premium. However, the bias towards higher levels of debt and lower levels of equity shows up as LEONI’s weighted average cost of capital (WACC) tending towards its cost of debt over time.

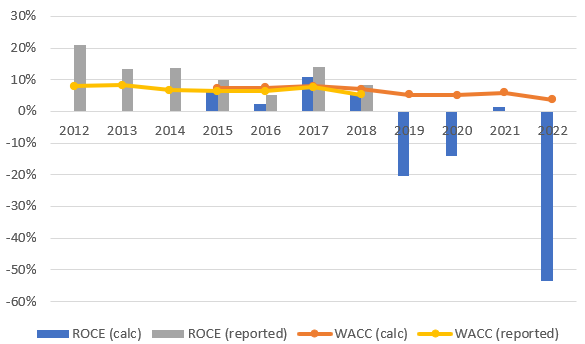
LEONI helpfully reported their Return on Capital Employed and Cost of Capital until 2018. It isn’t clear to me why they stopped reporting after that date, but that year also coincides with the last time I calculated a positive return on capital (which is also the last year without obvious external disturbances like Covid and the war in Ukraine). To provide more insight for years beyond 2018, I have calculated Return on Capital Employed (ROCE) and WACC myself for all years I have analysed. LEONI’s management analyses provide more specifics on their use of capital and make different decisions on what to include in their calculations, compared to what I can determine from the consolidated financial statements, so our two methods do not fully agree for the years where both calculations are available (my calculation typically shows a lower return on capital). However, I believe the two methods are close enough to provide similar levels of insight. This analysis shows that LEONI’s returns on capital had been decreasing since 2012, while the cost of capital had been fairly consistent, despite a temporarily high return in 2017. However, as a rule, returns were low and typically similar to the cost of capital - LEONI was struggling to provide returns much beyond the cost of accessing capital. This was a company (broadly) treading water prior to Covid.
Cash Flow and Earnings Quality
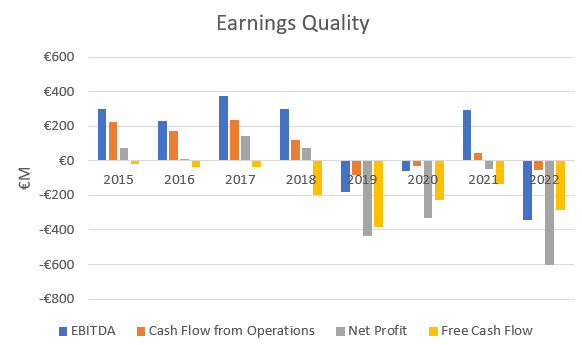
For me, the biggest warning sign comes from assessing LEONI’s cash flow statements. Although Earnings Before Interest, Taxes, Depreciation and Amortisation (EBTIDA) are NOT the same as cash flow from operations (which should incorporate interest and tax cash expenses), for a company which is generating cash from its operations, depreciation and amortisation are often the largest non-cash expenses, so EBITDA is something of a proxy for cash flow from operations (CFFO). Therefore it is reasonable to expect EBITDA is backed up by CFFO, in other words EBITDA should be of similar magnitude to CFFO, especially if interest and cash tax expenses are not that high. However, in LEONI’s case, CFFO is typically quite a bit below EBITDA, indicating that a considerable proportion of earnings is not coming from its continuing operations. Similarly, depreciation and amortisation are real expenses that need to be funded, and so another comparison on earnings quality to is check if earnings (aka net income, or net profit) are converting effectively to free cash flow. Free cash flow may well be less than net profit if the company is going through an investment cycle, and intentionally spending more capital than required just to maintain its existing capital investments. However, consistently negative free cash flow should be a cause for concern, as should free cash flow that is consistently far below reported earnings. That is the case here, with LEONI spending between 40% and 99% more in gross capital expenditure (CapEx) than its depreciation and amortisation (D&A) charge each year between 2015 and 2019. In 2020 and 2021, LEONI’s CapEx was less than its D&A expenses, and in 2022, CapEx again exceeded D&A costs, but only by 20% and was more than offset by the disposal of subsidiaries (their Industrial Solutions and several Fiber Optics subsidiaries).
N.B. Please note, I consider cash received from dividends from investments as an ‘investing’ cash flow, not as an ‘operating’ cash flow, so my CFFO calculations will be slightly different to those reported by LEONI.
Lastly, the company stopped paying its dividend in 2018. This could be seen as responsible capital management, and I wouldn’t disagree with that view, but it is also evidence of a need to preserve capital - never a good sign.
The Bottom Line
I think Leoni is a really interesting case study. When looking backwards with a known outcome, it’s very easy to become susceptible to narrative fallacies and confirmation bias, but let’s review the facts:
LEONI was a well-established, global company with a long history. It was a major automotive supplier with growing revenue up until Covid struck, and with a growing number of employees. It was also investing heavily in new capital assets
Before Covid, its EBIT margins looked relatively stable, although perhaps lower than they had been in the early 2010s, and of low absolute magnitude
Operating and net profit margins just before Covid (2018) were relatively poor, but not unusually poor relative to recent history at that time.
Liquidity was reducing and debt increasing just before Covid, but perhaps not to obviously unsustainable levels, especially given the negative cash conversion cycle (receiving cash before needing to spend it on creating products or paying suppliers)
Although Covid was obviously extremely painful for the company, the casual observer could be forgiven for thinking the company was starting to get back under control in 2021, with a meagre operating profit. Cash had remained relatively stable and interest expenses (as a percentage of total debt) had not increased to exorbitant levels
On the other hand, there were a few warning flags becoming apparent during Covid:
Liquidity ratios were on a long-term downward trend
Debt, both in absolute terms and relative to equity, had increased drastically over Covid
The company was actively engaged in selling off its business units
The stated earnings were not backed up by cash generation, and the company was spending more in capital investments than it was receiving from operations (so therefore relying to some extent on new debt to fund this CapEx)
Returns on capital were not exceeding the cost of capital - there was no obvious ability of management to grow the company to the benefit of shareholders.
The company stopped paying its dividend
Book value / equity was drastically reduced
A major red flag appeared for me in the 2021 accounts, namely current liabilities exceeding current assets and, in particular, current debt exceeding cash and equivalents. However, 2021 showed a (very) small pre-tax profit and small positive operating cash flow. It wasn’t until 2022 that the nails in the coffin became abundantly clear, with a total goodwill write-down and significant impairment charges, current debt vastly exceeding cash reserves and, finally, an inability to close a sale, resulting in liquidity drying up and ultimately loss of all shareholder equity. However, by the time the imminent collapse was this obvious, it was too late for investors.
If you are already invested, you believe in the future of the company. As you likely hold this belief to hold the shares, it is often harder to convince yourself of the risks than it might be for a truly impartial observer. Many people, including me, don’t want to sell or admit they were wrong, and would be likely to hold on to any positive indicators and downplay the negative indicators.
I believe if I had been invested, I would likely have blamed Covid as an exceptional event, obscuring true performance, and taken solace in the vastly improved performance in 2021 compared to 2019 or 2020. I think I would likely have held on into 2022, and could have paid heavily for that optimism. However, I may not have invested in the first place because of the low margins and declining returns and liquidity, even before Covid - as I wasn’t investing at that time, we’ll never know whether I would have had that level of foresight or not.
Learning a Lesson
This gives me food for thought with one of my holdings, INTC 0.00%↑ . It, too, has had declining gross margins. It, too, has undertaken strategic initiatives to redirect capital and try to improve performance. It, too, has cut its dividend and sold off or is considering selling off business units. It, too, is a major company with a global presence that has become loss-making. It has been forced into significant headcount reductions. There are many parallels. On the other hand, Intel’s debt is far lower, relative to its existing equity, and its cash and current assets are far higher, relative to its current liabilities. But this may change in the future, as Intel’s SCIP model reaches maturity. Yet I am still holding currently. This review of LEONI definitely makes me stop and think.
You can read my analysis on $INTC’s 2024 performance below:
Valuation: Intel (2024 FY)

In April of last year, I wrote a Deep Dive on Intel ( ) , based on financial results up until their end-of-year 2023 results. At the time, I viewed Intel as a turnaround play, with two potential outcomes - continued decline, even if the decline was stymied, or a successful turnaround with opportunity to match or beat AMD. At the time, the INTC share pri…
The Takeaway
Read the signs - in my opinion, the end came quite quickly for LEONI shareholders, and wasn’t obviously telegraphed far in advance. The adage that “Cash is King” is still true here, and ultimately it was failure to liquidate a business unit in the face of rampant debt maturity obligations that undid LEONI. Do you think you could have seen the end coming in time to get out? Even though there were signs of trouble, I’m genuinely not sure I would have interpreted them effectively in time.
https://www.annualreports.com/Company/leoni
https://www.leoni.com/en/press/releases/details/comeback-ziems-1
https://d3ga0yfowtcnef.cloudfront.net/fileadmin/group/datasets/downloads/publications/archiv-delisting/leoni_zusammenfassung-restrukturierungsplan_43507640.10_.pdf
https://www.leoni.com/en/press/releases/details/concept-leoni-3
https://www.leoni.com/en/press/releases/details/concept-leoni-2